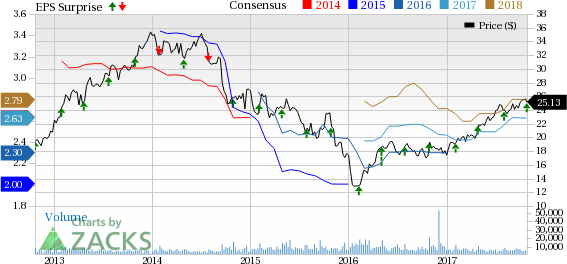
Owens-Illinois, Inc. (NYSE:OI) reported third-quarter 2017 adjusted earnings, up 13% year over year to 77 cents per share. The uptick primarily stemmed from improved segment operating profit in Europe and Latin America, and lower interest and tax expense. In addition, earnings surpassed the Zacks Consensus Estimate of 73 cents and exceeded the management’s guidance range of 70-75 cents per share.
Operational Update
Owens-Illinois’ net sales were up around 5% year over year to $1.79 billion. The improvement in net sales was due to a 1-percent increase in price on a global basis and favorable currency translation. Also, revenues beat the Zacks Consensus Estimate of $1.76 billion.
In Latin America, volumes climbed 5% year over year in the third quarter mainly due to higher beer and spirits shipments. Shipments in Mexico increased in mid-single digit, while shipments in Brazil are up significantly. Sales volume in the Asia-Pacific region rose 5% primarily due to elevated beer shipments in Australia. In Europe, sales volumes inched up 1% chiefly due to favorable product mix as shipments were flat. Meanwhile, in North America sales volume declined due to lower shipments, primarily in beer.
Cost of sales flared up 4.5% year over year to $1.4 billion. Gross profit ascended 5.1% to $353 million from $336 million recorded in the year-earlier quarter. Selling and administrative expenses edged down 0.8% to $120 million. Segment operating profit improved 10% year over year to $260 million. Segment operating profit margin expanded 70 basis points to 14.5% in the quarter.
Financial Update
Owens-Illinois had cash and cash equivalents of $339 million at the end of third-quarter 2017 compared with $492 million at the end of 2016. The company’s cash from operations decreased significantly to $39 million during the nine-month period ended Sep 30, 2017, compared with $226 million recorded in the comparable period last year.
Owens-Illinois’ long-term debt increased to $5,378 million at the end of third-quarter 2017 compared with $5,133 million reported at the end of 2016.
The company continues to make solid progress on executing its strategic initiatives. Its focus on total systems cost contributed approximately $8 million in cost savings in the third quarter, leading to a year-to-date total of $26 million.
Expansion of Strategic Joint Venture
Owens-Illinois has agreed to expand its 50-50 joint venture (JV) with Constellation Brands, Inc. (NYSE:STZ) The JV operates a glass container production plant in Nava, Mexico. The plant, established in 2014, provides bottles exclusively for Constellation Brands' adjacent brewery.
The original JV agreement included the expansion of the glass production plant from one furnace to four furnaces by 2018. The initial expansion plans have been progressing as scheduled, with three furnaces currently in operation. The fourth furnace is expected to be operational in the first half of 2018.
To meet the rising demand from Constellation Brands’ adjacent brewery, the newly-expanded relationship provides for the addition of a fifth furnace, which is expected to be operational by the end of 2019. This capacity expansion, which is estimated to cost approximately $140 million, will be financed by equal contributions from both partners. Furthermore, the term of the JV agreement was extended for 10 additional years to 2034.
Guidance
The company trimmed its earnings per share guidance for 2017 to the range of $2.60-$2.65, from the prior band of $2.55-$2.65. The slashed outlook mainly reflects uncertainty in macroeconomic conditions and currency rates.
Share Price Performance
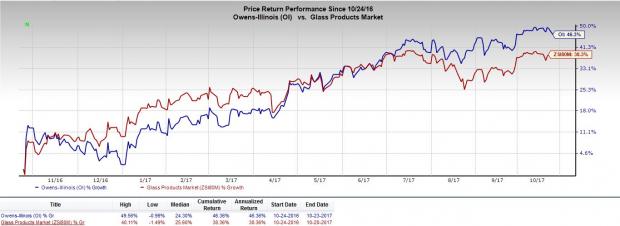
In the past year, Owens-Illinois has outperformed its industry with respect to price performance. The stock has gained around 46.3%, while the industry recorded growth of 38.3% during the same time frame.

Zacks Rank & Key Picks
Owens-Illinois currently carries a Zacks Rank #4 (Sell).
Better-ranked stocks in the same space include Barnes Group Inc. (NYSE:B) and Graco Inc. (NYSE:GGG) . Both the stocks flaunt a Zacks Rank of #1 (Strong Buy). You can see the complete list of today’s Zacks #1 Rank stocks here.
Barnes Group has an expected long-term earnings growth rate of 9%.
Graco has an expected long-term earnings growth rate of 10.5%.
Today's Stocks from Zacks' Hottest Strategies
It's hard to believe, even for us at Zacks. But while the market gained +18.8% from 2016 - Q1 2017, our top stock-picking screens have returned +157.0%, +128.0%, +97.8%, +94.7%, and +90.2% respectively.
And this outperformance has not just been a recent phenomenon. Over the years it has been remarkably consistent. From 2000 - Q1 2017, the composite yearly average gain for these strategies has beaten the market more than 11X over. Maybe even more remarkable is the fact that we're willing to share their latest stocks with you without cost or obligation.
See Them Free>>
Constellation Brands Inc (STZ): Free Stock Analysis Report
Owens-Illinois, Inc. (OI): Free Stock Analysis Report
Graco Inc. (GGG): Free Stock Analysis Report
Barnes Group, Inc. (B): Free Stock Analysis Report
Original post
Zacks Investment Research

