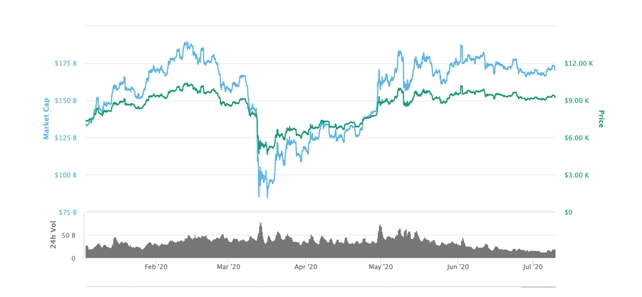
Bitcoin is, in some ways, struggling to break a significant threshold. Earlier this year, the asset hit the ground running and hit a peg of $10.260 as of February. However, the coronavirus pandemic hit and saw Bitcoin drop to a low of $4,890 – effectively clearing all the gains of last year. 
Source: CoinMarketCap
Unlike traditional stocks, Bitcoin did rise much faster. The halving helped significantly, but the asset has now found itself stuck between the $9,000 and $10,000 price points.
So, like it is whenever there appears to be a market stagnation, it’s worth checking some price theories and what they say about possible future events. CMO Nextiva stated that “historic events do not predict future events, so don't take that too literally,”
The Stock-to-Flow Model
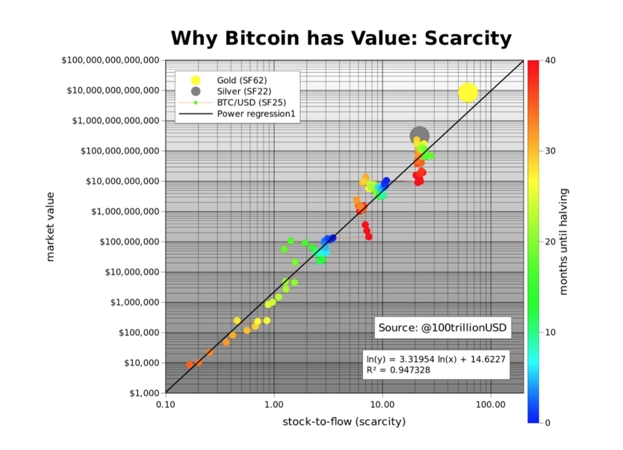
One of the most widely acknowledged price models for Bitcoin is the stock-to-flow model. It has so far proven to be accurate on several occasions, especially when it comes to checking past performances and evaluating possible price turns,
The term “stock-to-flow” considers the flow of a new supply of an asset relative to the amount of that asset that is already in the existing supply. The model looks into Bitcoin’s long-term trend and possible values based on how scarce the asset it.
Unlike most other assets, Bitcoin comes with a fixed monetary supply. This scarcity – as well as the fact that its supply is facing a constant reduction – has so far proven to be its most significant benefit.
Thus, the stock-to-flow model considers the stock-to-flow of gold and silver – two of the largest alternative assets in the world – and uses them as a benchmark. The model essentially believes that the value of gold has been able to hold up and stay relatively stable over the past centuries because it’s impossible for a single party to create the value of gold in circulating supply – a phenomenon which will all but render the asset worthless.
As stated earlier, Bitcoin has a fixed supply – unlike gold and silver. Also, the halving helps to reduce the value of Bitcoin in circulation – it is an event that no one has control over, thus making Bitcoin scarcer than gold and silver in theory.
The stock-to-flow model predicts that the market capitalization of Bitcoin will exceed $1 trillion after the halving of May 2020. It is in line with predictions before the halvings of 2012 and 2016.
In an article explaining how this could work, Plan B, a crypto analyst who is credited to creating the stock-to-flow model for Bitcoin, explains:
“The predicted market value for Bitcoin after May 2020 halving is $1trn, which translates in a Bitcoin price of $55,000. That is quite spectacular. I guess time will tell and we will probably know one or two years after the halving.”

Source: Plan B
The Elliott Wave
Many analysts use the Elliott Wave Theory to determine cycles in asset markets. The theory is widely acclaimed for its ability to effectively spot bear and bull cycles, and it runs based on the fundamental assumption that markets move based on the psychology of participants.
Usually, the application of the Elliott Wave Theory is more pronounced in bearish cycles. The theory presents an eight-part move, where an asset’s price reduces based on several levels.
However, some analysts also believe that the theory has a subjective nature. In addition, it has gotten criticism for always assuming that markets follow the same psychology, regardless of the times and seasons. As such, it could lead to extreme predictions on both bullish and bearish scenarios.
The Hyperwave Theory
The Hyperwave Theory determines the formation of a possible bubble in asset markets. For the crypto space, the theory got praised by Tone Vays, a famous trader and a proponent for Bitcoin Cash.
This theory functions as a seven-part market cycle that finds bearish trend reversals at their highest points. It has a structure that is strikingly similar to that of the Elliott Wave, although they differ in that this theory only refers to bearish situations.
However, these price predictions also have received widespread scrutiny for their assumption of asset peaks. Like the Elliott Wave Theory, many have also pointed out that this one could lead to extreme predictions.
Recently, Vays used the same theory to predict a possible drop in Bitcoin’s price that the industry hasn’t seen for over five years. Speaking on the Trading Bitcoin YouTube series last month, the established trader explained that the price of the asset won’t cross the $6,000 to $10,000 threshold until next year.
In a separate tweet, he explained that he used the theory in early 2018 to anticipate a price target of $1,500. However, the asset’s price only dropped to a low of $3,100.
“I was off by 12%. That was my margin of error. When I called $1,500 (from the January 2018 top), I was only off by 12% on the low of the bear market.”
As for his predictions of future prices, Vays explained in his series that the model still calls for a Bitcoin price close to about $1,000. He did point out that this might not be so accurate, explaining:
“I don’t know why people think I am still waiting for $1,200 or $1,500. That is a ridiculous view. People seem to be very confused. And for some reason, people seem to be very upset that when I said Bitcoin has a high probability of going to $1,500, I said it when Bitcoin was here [at a record high].”
Source: Plan B
