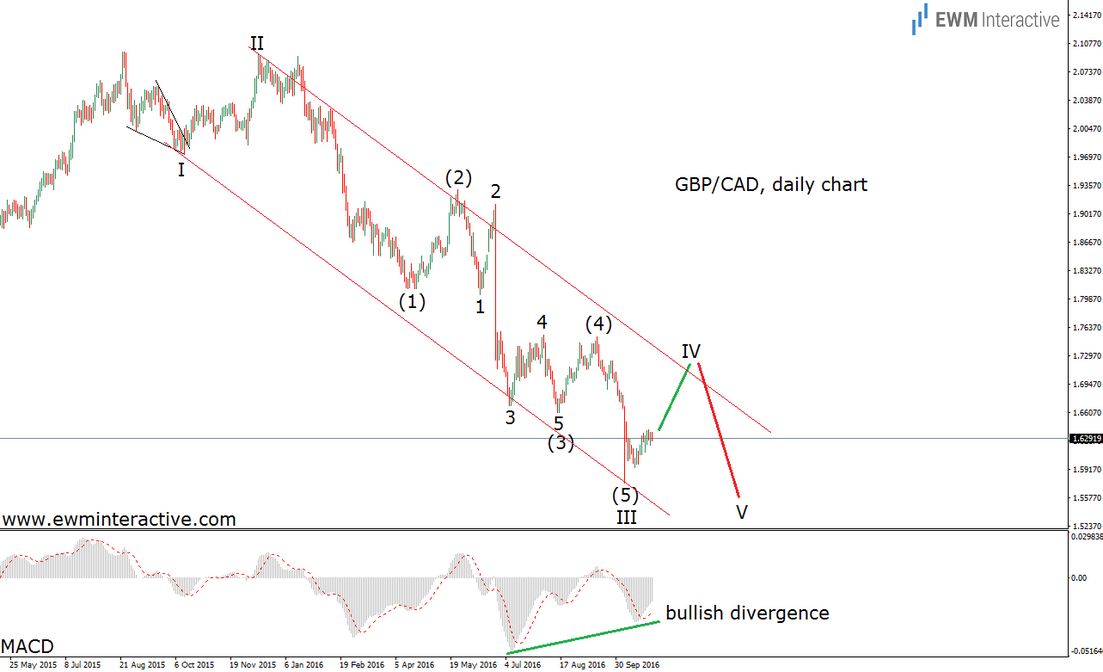
The Pound Sterling has been the biggest loser among all other major currencies in 2016, so it no surprise it has falling sharply against the Canadian dollar, as well. GBP/CAD was hovering close to 2.1000 in August, 2015, but after a series of crashes and selloffs it is currently trading below 1.6300. However, selling just because the rate is plunging is not a great strategy, because no trend lasts forever. There is always the risk of joining the trend just when it is about to reverse. That is why we rely on the Elliott Wave Principle to help us read the charts. The daily chart of GBP/CAD, given below, should give us a hint of what to expect next from this pair.

GBP/CAD’s daily chart visualizes the entire downtrend from 2.0972 in August,2015. So far, we cannot count it as a complete five-wave impulse to the south, but chances are it is going to evolve into one. Right now, we see waves I, which is a leading diagonal, followed by a deep wave II retracement, which gave the start of the powerful wave III between 2.0948 in December, 2015, and 1.5759 on October 7th, 2016. This leads to wave IV, which we believe is now under construction. Fourth waves usually retrace back to the area of previous fourth waves. In GBP/CAD’s case, wave IV could be expected to approach the price territory of wave (4) of III. Once there, the pair should also be under pressure by the upper line of the trend channel drawn through the lows of waves I and III and the top of wave II. It turns out this is not the best time to join the bears in GBP/CAD, because a recovery to 1.71-1.72 seems to be in progress. Furthermore, the MACD indicator is showing a strong bullish divergence between waves (3) and (5) of III, thus increasing the odds in favor of a rally. In other words, GBP/CAD remains in a downtrend, but we should prepare for a significant upside correction, before it resumes.
