
Northrop Grumman Corporation (NYSE:NOC) reported fourth-quarter 2017 earnings of $2.82 per share, beating the Zacks Consensus Estimate of $2.75 by 2.5%.
Reported earnings were $1.01, down nearly 65.9% from $2.96 recorded in the year-ago quarter. The decline was primarily due to higher tax expenses resulting from the enactment of the Tax Cuts and Jobs Act.
Total Revenues
In fourth-quarter 2017, Northrop Grumman reported total revenues of $6.63 billion, beating the Zacks Consensus Estimate of $6.37 billion by 4.1%.
Revenues also increased 3.7% from the year-ago figure of $6.39 billion. The revenue upside was primarily driven by increase in Aerospace Systems and Mission Systems sales.
Northrop Grumman Corporation Price, Consensus and EPS Surprise
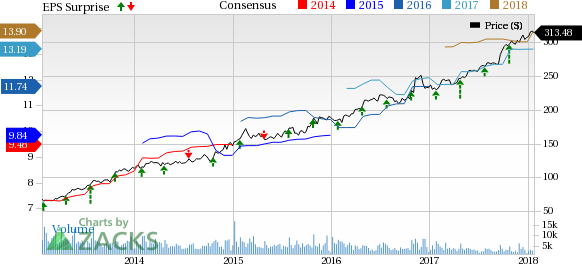
Northrop Grumman Corporation Price, Consensus and EPS Surprise | Northrop Grumman Corporation Quote
Segmental Details
Aerospace Systems: Segment sales of $3 billion increased 5% year over year due to growth in Manned Aircraft and Autonomous Systems, partially offset by lower Space sales.
However, Operating income was down 9% year over year to $298 million.
Mission Systems: Segment sales increased 6% to $3.02 billion due to higher volume for Sensors and Processing and Advanced Capabilities programs.
Operating income dropped 6.9% to $363 million while operating margin contracted 170 basis points (bps) to 12.0%.
Technology Services: Sales at the segment dipped 0.8% to $1.19 billion, driven by lower sales volume for System Modernization and Advance Defense Services programs.
Operating income increased 0.8% to $126 million while operating margin expanded 20 bps to 10.5%.
Operational Update
Total operating cost and expenses in 2017 increased 5.6% to $22.5 billion.
Operating income in 2017 increased 3.3% year over year to $3.3 billion.
Total backlog at the end of 2017 was $42.9 billion, down 5.5% from the year-ago period primarily due to year-over-year decline in Aerospace Systems and Technology Services.
Financial Condition
Northrop Grumman’s cash and cash equivalents as of Dec 31, 2017 were $12.2 billion, up from $2.54 billion as of Dec 31, 2016.
Long-term debt (net of current portion) as of Dec 31, 2017, was $14.4 billion, up from $7.06 billion as of 2016 end.
Net cash flow from operating activities at the end of 2017 was $2.61 billion compared with the year-ago figure of $2.81 billion.
Looking Ahead
Northrop Grumman expects to generate total revenues in excess of $27 billion in 2018. The company expects free cash flow in the range of $2 billion to $2.3 billion in 2018. The 2018 earnings are expected to be in the range of $15 to $15.25 per share.
Zacks Rank
Northrop Grumman carries a Zacks Rank #2 (Buy). You can see the complete list of today’s Zacks #1 (Strong Buy) Rank stocks here.
Upcoming Peer Releases
The Boeing Company (NYSE:BA) is expected to report fourth-quarter 2017 results on Jan 31 and the Zacks Consensus Estimate is currently pegged at $2.91. The company surpassed the Zacks Consensus Estimate in each of the trailing four quarters, with a positive average surprise of 5.84%.
Lockheed Martin Corporation (NYSE:LMT) is expected to report fourth-quarter 2017 results on Jan 29 and the Zacks Consensus Estimate is currently pegged at $4.06. The company surpassed the Zacks Consensus Estimate in three of the last four trailing four quarters, with a positive average surprise of 4.87%.
Textron Inc. (NYSE:TXT) is expected to report fourth-quarter 2017 results on Jan 31 and the Zacks Consensus Estimate is currently pegged at 75 cents. The company surpassed the Zacks Consensus Estimate in three out of last four trailing four quarters, with a positive average surprise of 1.47%.
Today's Stocks from Zacks' Hottest Strategies
It's hard to believe, even for us at Zacks. But while the market gained +18.8% from 2016 - Q1 2017, our top stock-picking screens have returned +157.0%, +128.0%, +97.8%, +94.7%, and +90.2% respectively.
And this outperformance has not just been a recent phenomenon. Over the years it has been remarkably consistent. From 2000 - Q1 2017, the composite yearly average gain for these strategies has beaten the market more than 11X over. Maybe even more remarkable is the fact that we're willing to share their latest stocks with you without cost or obligation.
See Them Free>>
Northrop Grumman Corporation (NOC): Free Stock Analysis Report
Boeing Company (The) (BA): Free Stock Analysis Report
Lockheed Martin Corporation (LMT): Free Stock Analysis Report
Textron Inc. (TXT): Free Stock Analysis Report
Original post
Zacks Investment Research