We normally spend a lot of time calculating and agonizing over Texas production, and got several hoo-hahs and worse over our estimate of 8.8 Mb. Post-report, the yield deniers for Texas cotton sound a lot like those in Chicago over the grain yields. Maybe there is optimism built into yields for the Aug report, but if it is, the numbers wont change much unless Mother Nature deals us a wild card during harvest. Even if TX yield at 741 #/a slips a bit, other states such as OK, Miss and LA are likely to gain.
The next country in play for yield will be India, as the USDA sat on the production at 29.0 Mb. This could rise or fall maybe 1.5 Mb as the last part of the growing season passes by. The more important part of the report is to get an eyeball on ROW end stocks. They just jumped over 50 Mb, and that would be the largest figure since?
Varner View
The balance sheet for US and world cotton is getting uglier. Some of our bullish friends are pulling out all kinds of scenarios to justify stable prices, as they have about given up on +7000. Tight nearby supplies, unknown monsoon action, and hopes of China needing high grades are all counted on to keep price up. Its 11 Aug and so far there has been no hurricane threat, but the bulls have that NOAA report behind them, promising above average storms this year. We think the balance sheet has a chance to get into such a burden that price will have to move lower to discourage production. That means a lot of work below 65c.
Technicals
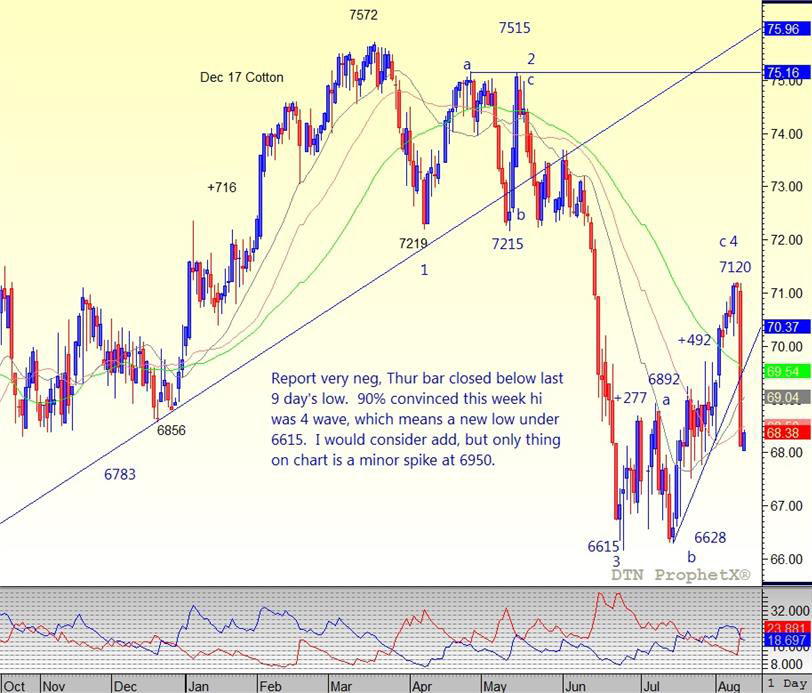
Where are some reasonable targets on the downside? Taking the length of the drop from 7572 to 6615, the 61.8% extension from 7120 is 6525, and the 100% is 6162. There is an old low on the Dec chart at 6550, and on spot chart at 6522. On the Dec continuous chart, assume the down move last Aug will be duplicated for this move, the target is 6315.

