💥 Fed cuts sparks mid cap boom! ProPicks AI scores with 4 stocks +23% each. Get October’s update first.Pick Stocks with AI

No Surprise For Volume Traders And Investors Over The Buying Climax!

Published 06/03/2020, 07:03 AM
Updated 07/09/2023, 06:31 AM
CAD/JPY
-
CL
-
USO
-

Many market commentators have been baffled by the recent bullish trend for equities, but for traders who apply volume/price analysis and also understand the relational aspects of market behaviour, the current rally has not only been expected, but was clearly signalled across the yen matrix for forex traders and investors. Moreover, the price action and volume associated with the plunge in stock markets also delivered a classic example of a buying climax and creating the perfect conditions to massive buying by the insiders and market makers on panic-selling.

Below is a weekly chart for CAD/JPY, but applies equally to all the other yen pairs and whilst this is on a slow time frame, the principles of volume-price analysis apply equally to any other, from the 1-minute to the 1-month.
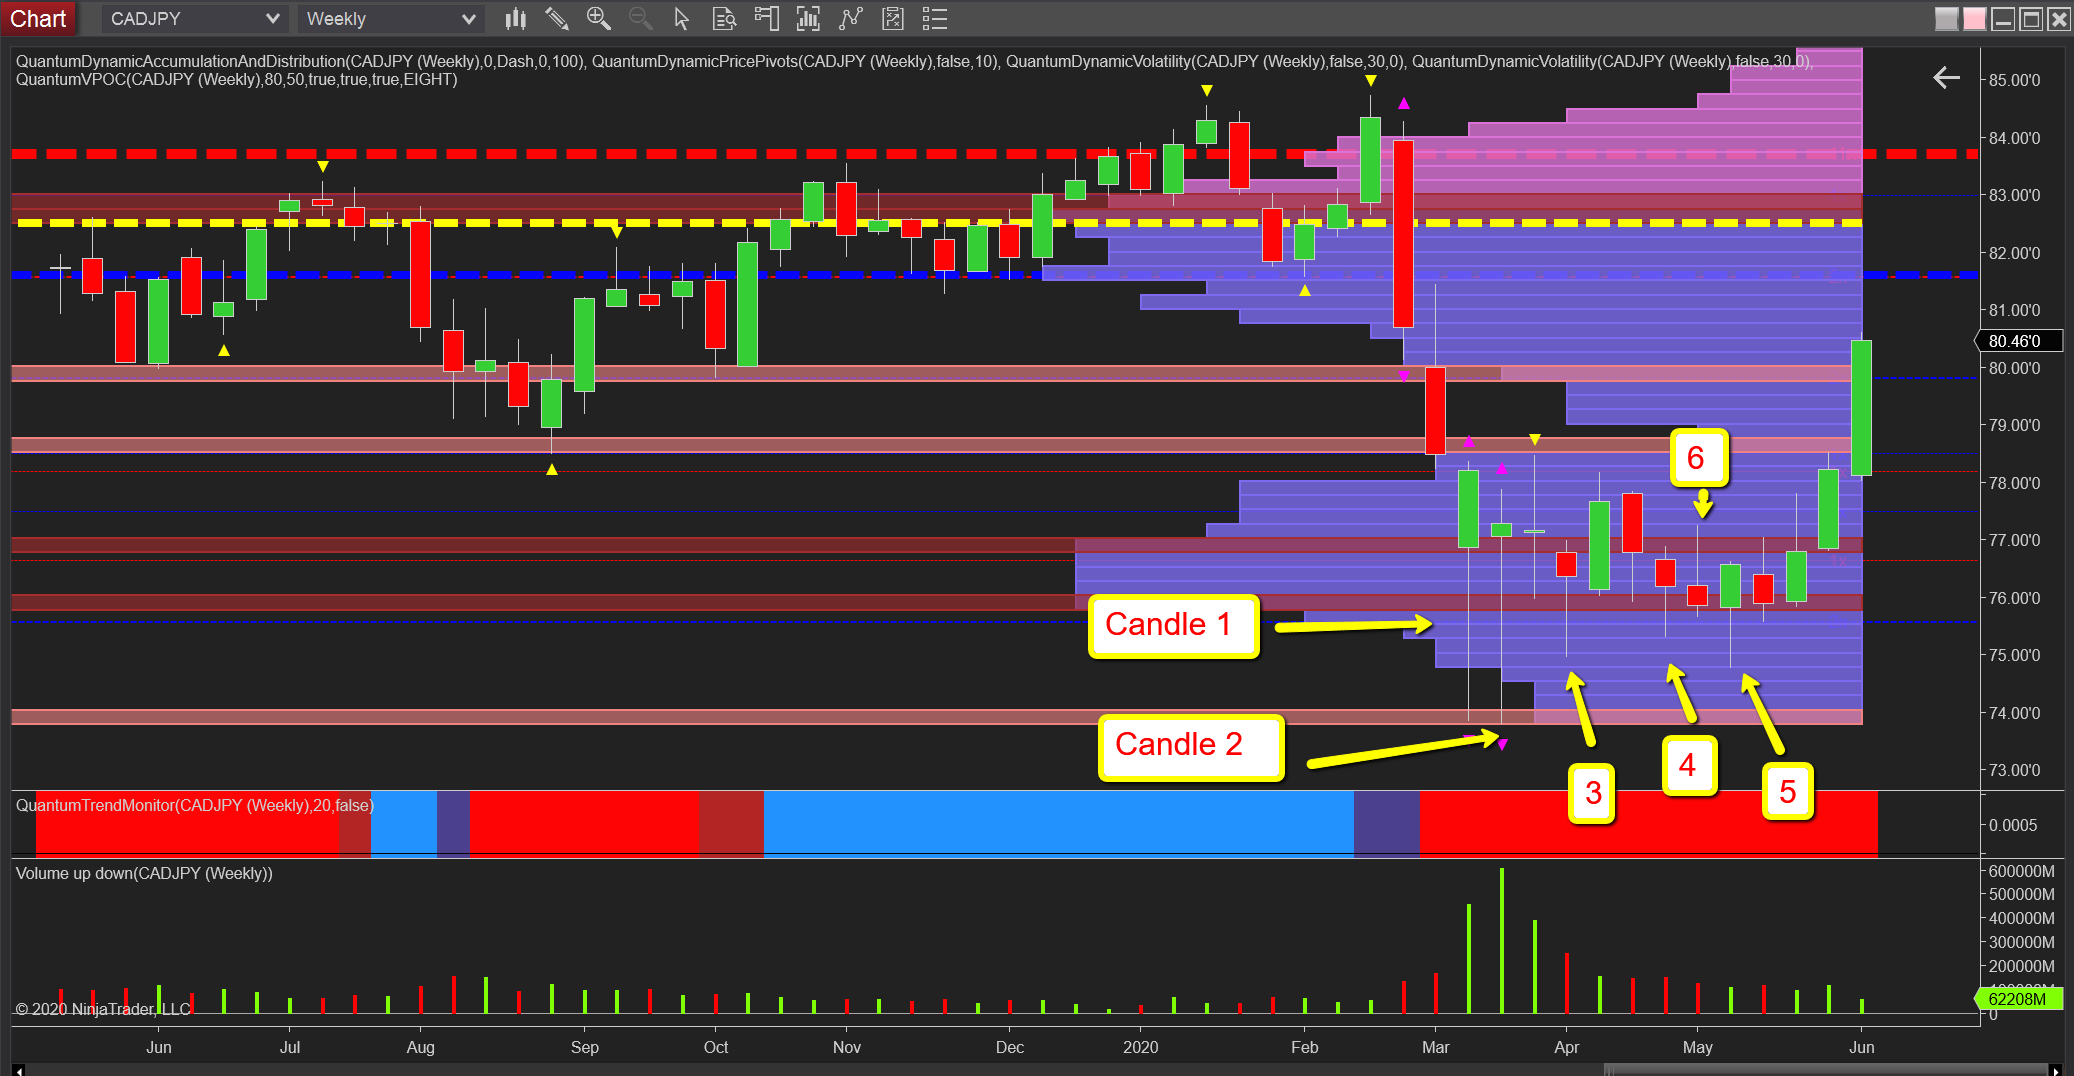
CAD/JPY Buying Climax - Weekly Chart

In any major market shakeout and plunge lower, at some point, we see stopping volume as market-makers step in. But, as always when the market has momentum, it takes a significant effort to absorb that selling pressure. The analogy here is of an oil tanker. Turn off the engines and it will continue for several miles under its own momentum.

The principles are the same here, so we see two weeks of absorption and stopping volume on candles 1 and 2. What follows is what we expect to see, consolidation and further mopping up of this pressure. Note candles 3, 4, and 5 as further selling is absorbed. But in each case, the volume is falling, so this confirms the sellers are finally draining away. Candle 6 is a gravestone candle with buyers starting to return and we have two more efforts to rise before the rally begins and makes its way through the low-volume node at 79 which was breached with ease as we would expect.

Now, as we progress, higher volume on the volume point of control histogram (y axis) becomes denser as we approach the volume point of control (VPOC) itself at 82.50 yen and there is also price-based resistance at 81.70, so we expect the rally to slow.  An increase in volume is now required to drive through both these levels, although we can first expect a phase of congestion at the VPOC in the 82.50 area.

And finally of course, for this pair, oil is also playing a helping hand.

Latest comments

Loading next article…
Risk Disclosure: Trading in financial instruments and/or cryptocurrencies involves high risks including the risk of losing some, or all, of your investment amount, and may not be suitable for all investors. Prices of cryptocurrencies are extremely volatile and may be affected by external factors such as financial, regulatory or political events. Trading on margin increases the financial risks.
Before deciding to trade in financial instrument or cryptocurrencies you should be fully informed of the risks and costs associated with trading the financial markets, carefully consider your investment objectives, level of experience, and risk appetite, and seek professional advice where needed.
Fusion Media would like to remind you that the data contained in this website is not necessarily real-time nor accurate. The data and prices on the website are not necessarily provided by any market or exchange, but may be provided by market makers, and so prices may not be accurate and may differ from the actual price at any given market, meaning prices are indicative and not appropriate for trading purposes. Fusion Media and any provider of the data contained in this website will not accept liability for any loss or damage as a result of your trading, or your reliance on the information contained within this website.
It is prohibited to use, store, reproduce, display, modify, transmit or distribute the data contained in this website without the explicit prior written permission of Fusion Media and/or the data provider. All intellectual property rights are reserved by the providers and/or the exchange providing the data contained in this website.
Fusion Media may be compensated by the advertisers that appear on the website, based on your interaction with the advertisements or advertisers.
© 2007-2024 - Fusion Media Limited. All Rights Reserved.