I hear a lot about bubbles. I see potential bubbles in play, but let’s look at the data.
Indexed GDP (blue line), Home Price Index (pink line), Disposable Personal Income (red line), and S&P Stock Price (green line) – all data in current dollars, no inflation adjustments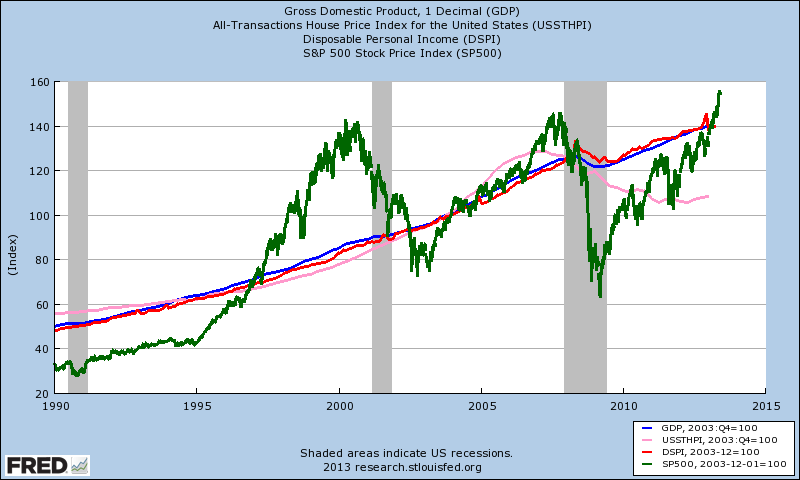
The only bubble one can see building in the above graph is the stock market – if one accepts that the Wall Street measure of economic growth – GDP – would be a control or baseline for stock market valuation. And housing prices are well under the growth of GDP – but housing is a Main Street sector, while GDP is a Wall Street measure. GDP should not be used as a control for housing prices.
What should be a control is family income – specifically median family income. A house price must be affordable for the family. But median data is not maintained in real time – which forces use of per capita data (red line in below graph) which logically overstates a median (as it is distorted by the 1% who earn 20%+ of the personal income).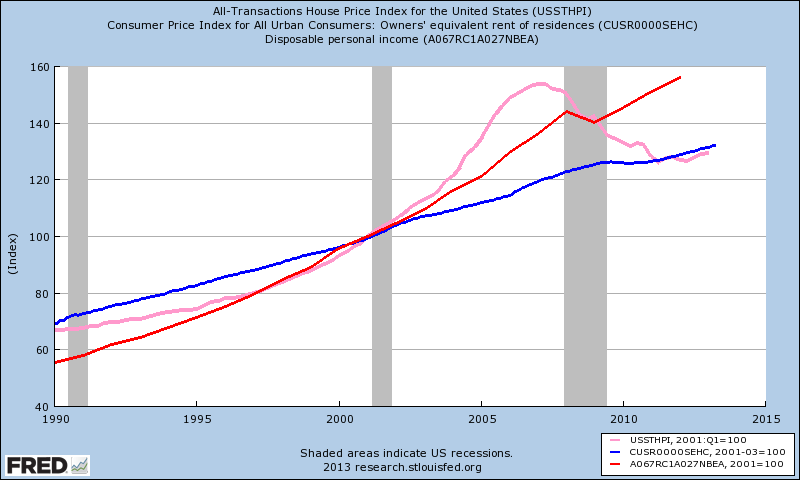
The above graphic uses Owner’s Equivalent of Rent (blue line) – the amount of rent that could be paid to substitute a currently owned house for an equivalent rental property. Using the Housing Price Index of the US (pink line) and comparing it with rent equivalents (blue line) – it seems housing prices and rents correlate – no bubble is evidenced here.
Another kick at this can – substituting hourly pay (red line) for per capita income yields a similar outcome – no sign yet of a housing bubble (see graph below).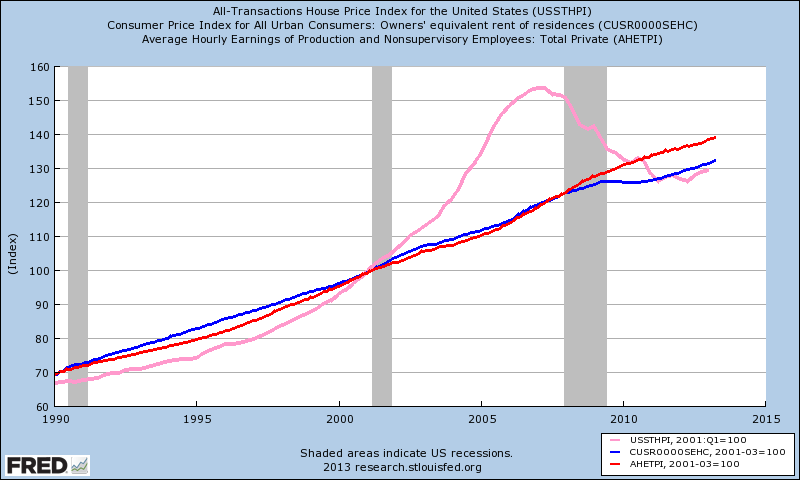
A final kick at this can – comparing the USA situation with other OECD members. It is somewhat dangerous to compare different economies because of gearing. But if one looks at this using the other data presented, it does continue to paint the same theme that a housing bubble does not currently exist in the USA.
House prices differ widely across OECD countries, both with respect to recent changes and to valuation levels. The change in the real price compared to a year earlier is used to tell whether prices are rising or falling. For valuation, if the price-to-rent ratio (a measure of the profitability of owning a house) and the price-to-income ratio (a measure of affordability) are above their long-term averages, house prices are said to be overvalued, and vice-versa. 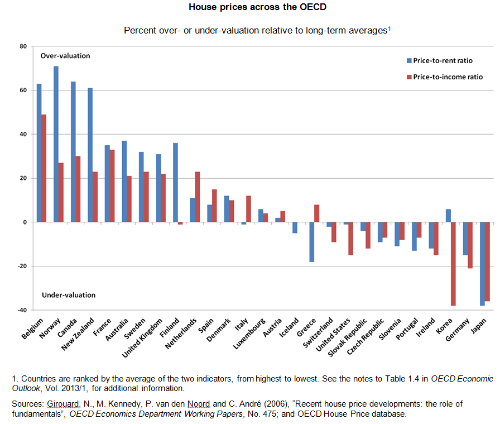
However the bubble question really is not resolved in my view:
- Are home price increases of 10%+ per year in a 2% economy beginning to build another housing bubble?
- 16 million jobs are missing in the economy considering population growth since the beginning of the Great Recession. Roughly this means 7 million households are without one of the former wager earners – or have lost all wage earners. Does this skew the data as 7 million new households have dropped to the lower end of the housing market where most rentals exist (increasing demand and rental prices in the lower end of the housing market)?
- The low interest rates do make a better house more affordable – but one needs good credit to enjoy these rates. What happens when interest rates rise making homes less affordable? Are lower interest rates themselves creating a potential bubble as homes will be less affordable when interest rates rise?
- The Economist has published a snapshot review of U.S. housing prices and also does not see a bubble. However, there are several postings in GEI Analysis that find troubling aspects of the housing market. See GEI News summary of The Economist article with links to other views.
- too many homes in some places, too few in others;
- movement trend to cities from suburbs;
- too little low cost housing, too much middle cost housing;
- smaller family sizes;
- too many institutional buyers of single family homes who eventually must resell;
- banks holding on to foreclosed single family homes creating less supply;
- too many boomers.
Other Economic News this Week:
The Econintersect economic forecast for June 2012 again declined marginally, and remains under a zone which would indicate the economy is about to grow normally. The concern is that consumers are spending a historically high amount of their income.
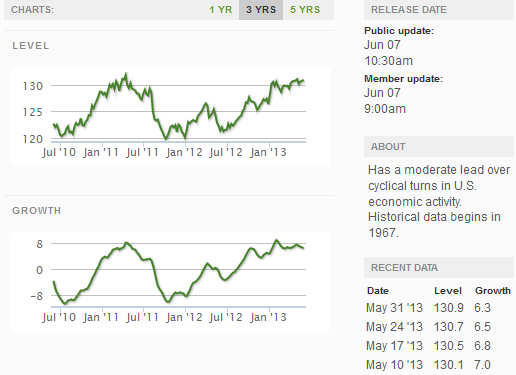
The ECRI WLI growth index value has been weakly in positive territory for over four months – but in a noticeable improvement trend. The index is indicating the economy six month from today will be slightly better than it is today.
Current ECRI WLI Growth Index
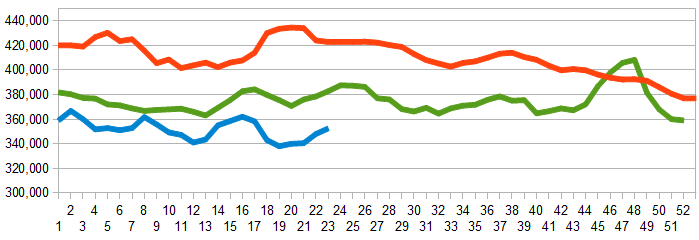
Initial unemployment claims declined from 354,000 (reported last week) to 346,000 this week. Historically, claims exceeding 400,000 per week usually occur when employment gains are less than the workforce growth, resulting in an increasing unemployment rate (background here and here).
The real gauge – the 4 week moving average – worsened from 347,250 (reported last week) to 352,500. Because of the noise (week-to-week movements from abnormal events AND the backward revisions to previous weeks releases), the 4-week average remains the reliable gauge.
Weekly Initial Unemployment Claims – 4 Week Average – Seasonally Adjusted – 2011 (red line), 2012 (green line), 2013 (blue line)
Bankruptcies this Week: Digerati Technologies, Triad Guaranty, Privately-held iGPS Company,
Data released this week which contained economically intuitive components(forward looking) were:
- Rail movements are beginning to show a modest growth trend.
Click here to view the scorecard table below with active hyperlinks
Weekly Economic Release Scorecard:

Which stock should you buy in your very next trade?
With valuations skyrocketing in 2024, many investors are uneasy putting more money into stocks. Unsure where to invest next? Get access to our proven portfolios and discover high-potential opportunities.
In 2024 alone, ProPicks AI identified 2 stocks that surged over 150%, 4 additional stocks that leaped over 30%, and 3 more that climbed over 25%. That's an impressive track record.
With portfolios tailored for Dow stocks, S&P stocks, Tech stocks, and Mid Cap stocks, you can explore various wealth-building strategies.
