The Nikkei is looking to gain on the back of renewed optimism in the markets.
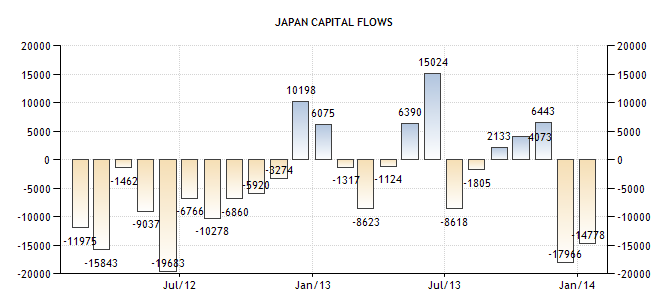
With the coming of Abenomics and a change in leadership for the Bank of Japan, investors have been eagerly eyeing up the Japanese markets. This has led to swings of capital inflows and outflows for the Japanese economy as investors and traders bet aggressively on the direction of the Japanese economy.

Source: Trading economics
While it's clear that initial market optimism was probably a little over zealous with Abenomics, it's certainly not clear whether much has changed in the markets as a whole in Japan. What is clear however, is that heavy selling was a theme for markets in January and February, even though it looks to be slowly abating with recent forecasts expecting a dramatic fall in the next few months.
These revised forecasts are in part due to the nature of the Bank of Japan, which has commented that it will do everything in its power to hit the 2.0% inflation target, and additionally, would look outside traditional securities in order to boost the markets and provide more liquidity.
With a reduction in capital flows forecast and the recent jump of the Yen breaking outside its range, things are starting to look bullish. I bring about the point of the Yen breaking out of its range due to the correlation between the Nikkei and the Yen (chart below shows it clearly). As the Yen devalues, the Nikkei rises accordingly – as Japan’s primary industry is exporting technology, goods and services.
![Nikkei [Blue], Yen [Green] Nikkei [Blue], Yen [Green]](https://d1-invdn-com.akamaized.net/content/picfda3e8b44676b537fc90af99636fdefb.png)
Source: Bloomberg (Nikkei [Blue], Yen [Green])
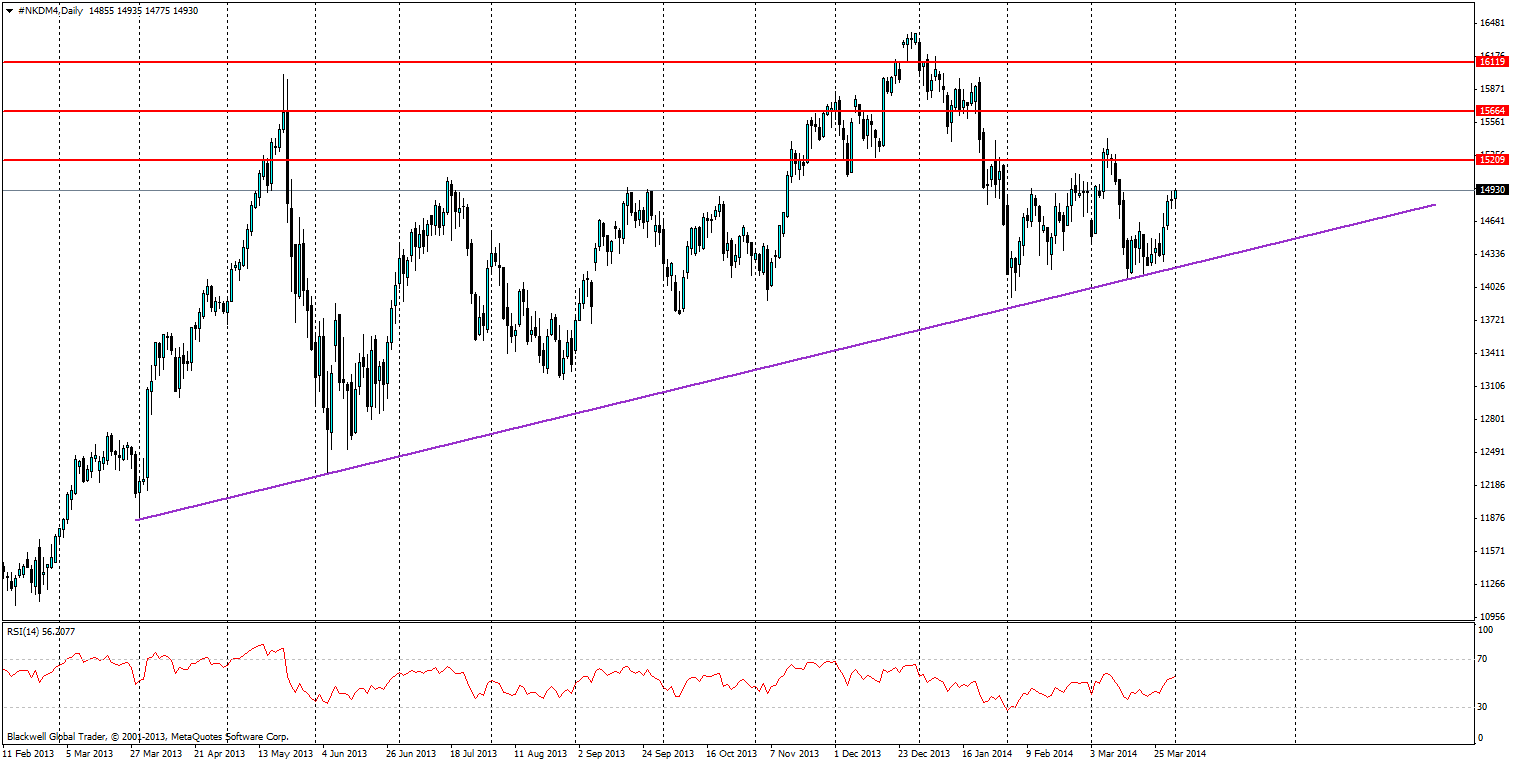
The Nikkei on the charts has recently touched on a bullish trend line which has been in play for a year now and has since looked to push harder. The trend line itself has been tested on numerous occasions and is looking very strong in the current market climate.
Despite the recent uptrend in the market, it's important to look at the Yen, which has been ranging over the last few months with little-to-no direction. However, last night it broke out of its current range and started to weaken further on the back of the recent sales tax.

Source: Blackwell Trader
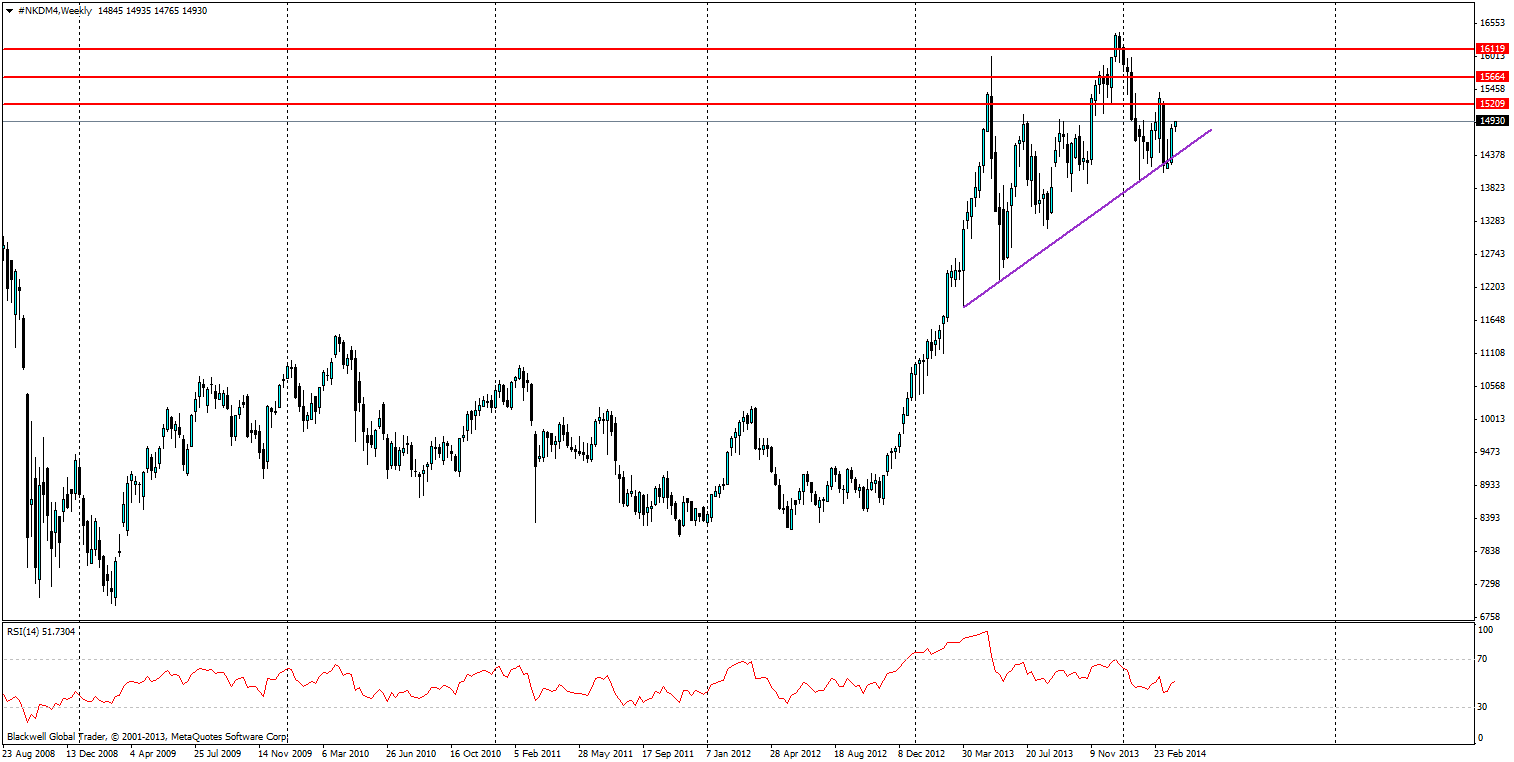
Looking at the Nikkei on the charts, it’s clear that there is certainly potential for more upward movements in the long term. The weekly chart also supports further movements upward, showing a bullish market.

Source: Blackwell Trader
Resistance levels can be found at 15209, 15664 and 16119. All of the resistance levels will likely have a big impact on markets but the 16000 level will be the hardest to crack as markets have pushed through once before pulling back.
The Nikkei is currently a good opportunity in the long run for traders looking to take advantage of the index. Further supporting it is the likelihood of stimulus from the Bank of Japan. This will start to weigh on markets closer to the time helping it to lift. The actual time frame is not expected to be announced for some time but markets will certainly start to price in movements and try and beat the ‘curve’.
