Source Blackwell Global Trader
The Nikkei 225 has been climbing now for some time, and for a lot of commentators and market watchers, it has run out of steam. But is that really the case?
The Nikkei 225 is made up of the top performing companies on the Tokyo based exchange, it is one of the most closely watched global stock markets and is also one of the most traded. When it comes to CFDs, the Nikkei is one of the most popular after the S&P and Dow. Its large array of well known companies and strong performance in the past year has brought the attention of many investors and traders globally.

Source Blackwell Global Trader
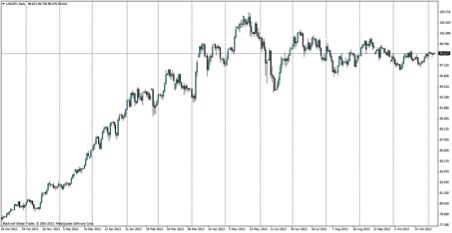
Shadowing the Yen, the Nikkei 225 has grown rapidly as investors have pushed capital into the once stagnant market. The reasoning behind this has been the weakening Yen, as Japan’s primary companies are massive exporters with the likes of Toyota and Mitsubishi – all of which benefit from a drop in the value of the Yen.
Foreign capital has flooded into the stock market amid confidence in Abenomics and also flooded back out, but for the most part, investor confidence in a resurgent stock market has been very high. And recently, that confidence has been rewarded with major companies upgrading their earnings.
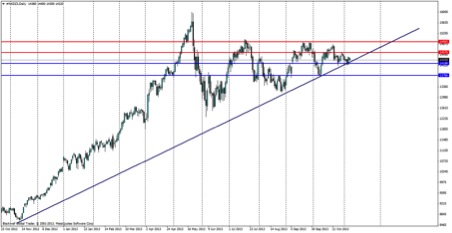
The question remains though, will the Nikkei rise further. I believe there is still a fair amount of room for it to move upwards. As seen on the chart above, the current trend is still bullish in the long run.
 USD/JPY" title="USD/JPY" height="277" width="464">
Source Bloomberg
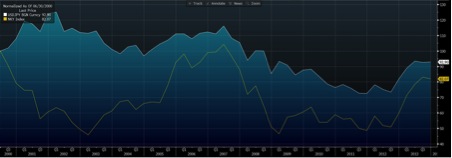
The major concern I have though with the Nikkei rising further, is that over the last 5 years we have seen a correlation appear between the Nikkei 225 and the USD/JPY. This correlation is evident to the naked eye when viewing the charts, and is something I believe investors should be aware of. The chart above highlights this correlation which is very much apparent.
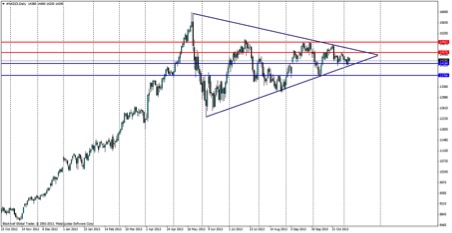
The Nikkei Index looks like an attractive buying opportunity when you look at it externally, but investors should be aware of the correlation and the pattern that has formed. The best way to trade the Nikkei Index, I believe, is to use the technical triangle that is evidently in place, catching the pair on the support and resistance levels as it moves between the triangle. It’s worth noting that the USD/JPY is currently trading within a technical triangle as well.

Source Blackwell Global Trader
The breakout of the triangle is difficult to predict at this stage, but it's coming. I am not sure yet how it will break out, but certainly over the last month the Japanese government and the Bank of Japan have looked to keep its massive stimulus flat. However, with tax hikes required in 2014, more stimulus may be required in order to keep the current economic program of Abenomics on track to achieve the 2% inflation. If the correlation is anything to go on, then a breakout upwards is the long term forecast. Global economists and analysts expect that the Yen is likely to weaken further in the long run, as capital outflows to find higher returns next year will weigh heavily on the currency, which will in turn give a boost to the Nikkei.
Written by Alex Gurr, Currency Analyst with Blackwell Global.
- English (UK)
- English (India)
- English (Canada)
- English (Australia)
- English (South Africa)
- English (Philippines)
- English (Nigeria)
- Deutsch
- Español (España)
- Español (México)
- Français
- Italiano
- Nederlands
- Português (Portugal)
- Polski
- Português (Brasil)
- Русский
- Türkçe
- العربية
- Ελληνικά
- Svenska
- Suomi
- עברית
- 日本語
- 한국어
- 简体中文
- 繁體中文
- Bahasa Indonesia
- Bahasa Melayu
- ไทย
- Tiếng Việt
- हिंदी
Nikkei 225: Buying Opportunity Or Buyer Beware?
Published 11/07/2013, 02:55 AM
Updated 05/14/2017, 06:45 AM
Nikkei 225: Buying Opportunity Or Buyer Beware?
Latest comments
Loading next article…
Install Our App
Risk Disclosure: Trading in financial instruments and/or cryptocurrencies involves high risks including the risk of losing some, or all, of your investment amount, and may not be suitable for all investors. Prices of cryptocurrencies are extremely volatile and may be affected by external factors such as financial, regulatory or political events. Trading on margin increases the financial risks.
Before deciding to trade in financial instrument or cryptocurrencies you should be fully informed of the risks and costs associated with trading the financial markets, carefully consider your investment objectives, level of experience, and risk appetite, and seek professional advice where needed.
Fusion Media would like to remind you that the data contained in this website is not necessarily real-time nor accurate. The data and prices on the website are not necessarily provided by any market or exchange, but may be provided by market makers, and so prices may not be accurate and may differ from the actual price at any given market, meaning prices are indicative and not appropriate for trading purposes. Fusion Media and any provider of the data contained in this website will not accept liability for any loss or damage as a result of your trading, or your reliance on the information contained within this website.
It is prohibited to use, store, reproduce, display, modify, transmit or distribute the data contained in this website without the explicit prior written permission of Fusion Media and/or the data provider. All intellectual property rights are reserved by the providers and/or the exchange providing the data contained in this website.
Fusion Media may be compensated by the advertisers that appear on the website, based on your interaction with the advertisements or advertisers.
© 2007-2025 - Fusion Media Limited. All Rights Reserved.
