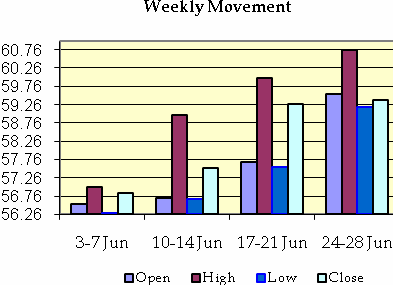
The Indian currency slumped to an all time record low of 60.76per dollar this past month. The rupee lost 5.01 percent in June after foreign investors sold a net $7 billion in bonds and shares for the month, and ended down 9.37 percent in April-June, its biggest quarterly fall in nearly two years.
However, the rupee made a sharp recovery by the end of the month and on the last day of the month the rupee posted its biggest daily gain in nine months fuelled by a robust rally in local stocks, with the government's move to raise gas prices for the first time in three years also aiding sentiment.
The gas price hike raised expectations that the government would also announce other potentially unpopular moves, such as opening up more sectors to foreign investment. RBI has also mandated that foreign banks limit themselves to placing hedging-related trades on onshore forward markets on behalf of clients, and not using existing client positions to make other trades, such as proprietary trading. Foreign banks will also need to verify that any hedging-related trades by their clients line up with the value of securities held by that client's account.
Though this move will reduce demand for forward dollars and cut speculative trades, the impact would be limited since foreign investors can bypass onshore markets and take positions in the offshore rupee market.

The sharp recovery in the rupee from a record low of 60.76 hit last Wednesday was also helped by talk of corporate inflows related to Diageo Plc's stake purchase in United Spirits Ltd, as well as selling by exporters. Fears of an early end to the U.S. Federal Reserve's monetary stimulus hit emerging markets in June. However, recent efforts by Fed officials to calm the markets have been welcomed by the investors and sparked global risk rally.
The rupee's recovery boosted government bonds, leading the fixed income association to widen trading bands for the day, in contrast to recent weeks when the same action was taken to counter a sharp fall in the debt market. Annualized forward premia for 1mth, 3mth and 6mth ended at 6.47%, 5.91% and 5.84% respectively. Asian currencies advanced, snapping a two-week slump, on speculation the Federal Reserve will hold off from paring asset purchases after U.S. first-quarter growth trailed an earlier estimate. The Bloomberg-JPMorgan Asia Dollar Index (PCOMP) of 10 regional currencies rose 0.4 percent this past week to 115.79. The Philippine peso strengthened 1.2 percent since June 21 to 43.205 per dollar, the best weekly gain in a year, according to data compiled by Bloomberg. Malaysia’s ringgit jumped 1.2 percent to 3.1648 and the South Korean won climbed 1.1 percent 1,142.06. Taiwan’s dollar appreciated 0.5 percent to NT$30.12.
INDIAN STOCK MARKET
The benchmark BSE index rose 2.75 percent, or 519.86 points, to end at 19,395.81. Despite the weekly gain, the index fell 1.8 percent lower for the month while rising about 3 percent for the quarter. The broader NSE index rose 2.81 percent, or 159.85 points, to end at 5,842.20. It gained 3.1 percent for the week but fell 2.4 percent June. Indian indices jumped nearly 3 percent on Friday, their highest single-day gain in 22 months, after a steep hike in natural gas price led to a buying spree in energy shares and short covering in financials. A strengthening rupee also aided sentiment. Foreign institutional investors were net equity buyers to the tune of Rs 1,124 crore on Friday snapping a 13-day selling spree. FIIs sold shares worth almost Rs 12,000 crore since June 11 on worries that the US Fed would start pruning its monetary stimulus measures sooner-than-expected.
RUPEE AND BOND YIELDS
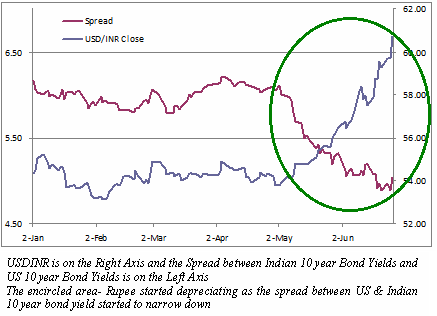
Indian bonds which attracted record overseas funds because of their high yields are losing their sheen because of rise in yields in the US. In fact, the falling yields of Indian bonds have added to the negative outlook for fund flows. FIIs have sold US$ 5683.48 million worth of bonds in India in June 2013 as the higher Indian yield advantage vanishes. The following graph tracks the movement of USDINR and the spread between Indian and US 10-year Treasury yields.
At the beginning of April this year, the 10-year Indian Government bonds yield was ruling around 8% and the 10-year US Treasury bond yield was around 1.75% - a huge gap of approximately 625 bps. In fact comparing the Indian bond yields with Japanese bond yield which was around 0.57%, the gap was even bigger of approximately 743 bps.

After that, Indian Government bond yields fell sharply to touch 7.09% in May, whereas US Treasury yields rose to 2%, thereby narrowing the yield gap to just 509 bps and Japanese yields inched closer to 1% mark, thus making Indian bonds yields extremely unattractive to the foreign investors amid USD and Japanese Yen becoming stronger and Indian rupee losing its value. By late May and June, after the announcement of QE tapering by the US Federal Reserve, the US bond yields jumped even sharper, crossing 2.60% mark on June 25th, making it more attractive to the long-term US investors.
With this movement in bond yields, the gap between the US Treasury and Indian Government bonds have narrowed below 500 bps. With hedging cost at about 6.5%, Indian bonds do not give any incentive to the FII to invest in them. A 2.50% return in US bonds is a more preferred option for FIIs. Hence, US and Japanese investors would like to invest in their own country in order to avoid risks related to currency and other geopolitical factors.
The Reserve Bank of India has cut key interest rates by almost 125 basis points since April last year and faltering economic growth may push the central bank to cut rates further in this fiscal year even more as inflation continues to be at acceptable levels. This may further dent the attractiveness of Indian bonds. However, a falling rupee would make our imports costlier, which would again fuel inflation and thereby forcing the RBI to increase its policy rates in order to reduce liquidity from the system and save the rupee from a further fall. Ultimately, it would result in a higher yield on Indian government bonds/securities making them attractive again to the FIIs. It is yet to be seen when and where the yield’s spread begin to rise once again in India’s favour.
MACRO ECONOMIC INDICATORS
- For the March quarter, CAD narrowed to $18.1 billion, or 3.6 per cent of GDP, from an all-time high of $32.6 billion, or 6.7 per cent of GDP, the previous quarter. During 2012-13, CAD stood at $87.8 billion (4.8 per cent of GDP), against $78.2 billion (4.2 per cent of GDP) during the previous financial year. A burgeoning trade deficit, along with a significant decline in invisible earnings, caused widening of CAD during the year. For the financial year ended March, the country had a balance of payments surplus of $3.83 billion, compared with a deficit of $12.8 billion a year earlier.
- India's foreign exchange reserves fell to $287.846 billion as on June 21 from $290.658 billion in the previous week.
- India’s external debt, as at end-March 2013, rose to $ 390.0 billion showing an increase of $ 44.6 billion or 12.9 per cent over the level at end-March 2012. The increase in total external debt during financial year 2012-13 was primarily on account of rise in short-term trade credit. There has been sizeable rise in external commercial borrowings (ECBs) and rupee denominated Non-resident Indian deposits as well.
Fundamental
Markets will enter into an eventful week with a number of important economic data that would trigger adjustment in expectation of the pace of Fed's scaling back of quantitative easing and would probably set the tone for Q3. Friday's non-farm payroll report from US is particularly important. But before that, there will also be ADP employment, ISM indices and respective employment components.
Other events to watch include PMIs from China and UK, employment data and PMI from Canada, Tankan survey from Japan and retail sales from Australia. Of course, RBA and ECB rate decision will be closely watched. BoE rate decision would possibly be a non-event though.
The rupee could see some consolidation in the near term, especially as the government gears up to announce more fiscal and economic reforms, but will remain constrained if foreign investors continue to sell. Desperate times calls for desperate measures and Indian Government is not oblivious of it as the economy faces the multiple problems of widening current account deficit, maintaining growth, weakening currency against the dollar, major outflow of foreign investors and upcoming election next year.
Attracting foreign flows is critical for India after its current account deficit hit a record high 4.8 percent of gross domestic product in the fiscal year ended in March. In its biannual Financial Stability Report (FSR) , RBI said the macroeconomic risks to the Indian economy have increased over the last six months due to the fall in growth, external sector developments and subdued performance of the corporate sector. The report said financing the high current account deficit (CAD), which hit an all-time high of 4.8% of GDP in FY13 - a key concern on the external front - is a "stress point" for the economy as evident from the recent rupee depreciation on global cues. Even though last 2-3 trading sessions saw rupee getting some respite but in view of the above macro factors this relief seems to be temporary. The flows from HUL for its open offer will also be over this week and then market may witness renewed buying pressure. USD/INR remains a buy on every dip albeit with tight stops.
Technical
The rupee posted its worst month in June in terms of the closing price and hitting all time low at the 60.76. On weekly time frame in technical chart a bearish shooting star formation is seen which indicates some technical downside price correction for USD/INR is due in market. RSI above 68 also supports price correction.
The Volatility Index at large is on the higher side in Weekly timeframe. However the bullish trend in the pair is still intact until 57.65 is broken out in the near term and it sustains below 57.29 for two consecutive trading sessions. We could expect the rupee to consolidate/strengthen in July. On the chart, the rupee could find major resistance around 58.60 and 57.65.
The probability of the rupee breaching 57.29 is dim and 57.71 may be an ideal upside level for this month. On the flipside 60.50 will provide major support. This view could be wrong if the rupee breaks 60.75 one more time. Bearishness in the rupee is still intact and 62.60 levels are open for the rupee in the coming months until any indication confirms bullish sign for the rupee on chart in the short term.
Month’s Trend: Mild near term bullishness in USD/INR but undertone remains bearish. ZigZag movement expected. Expected Range: 57.70 - 60.35