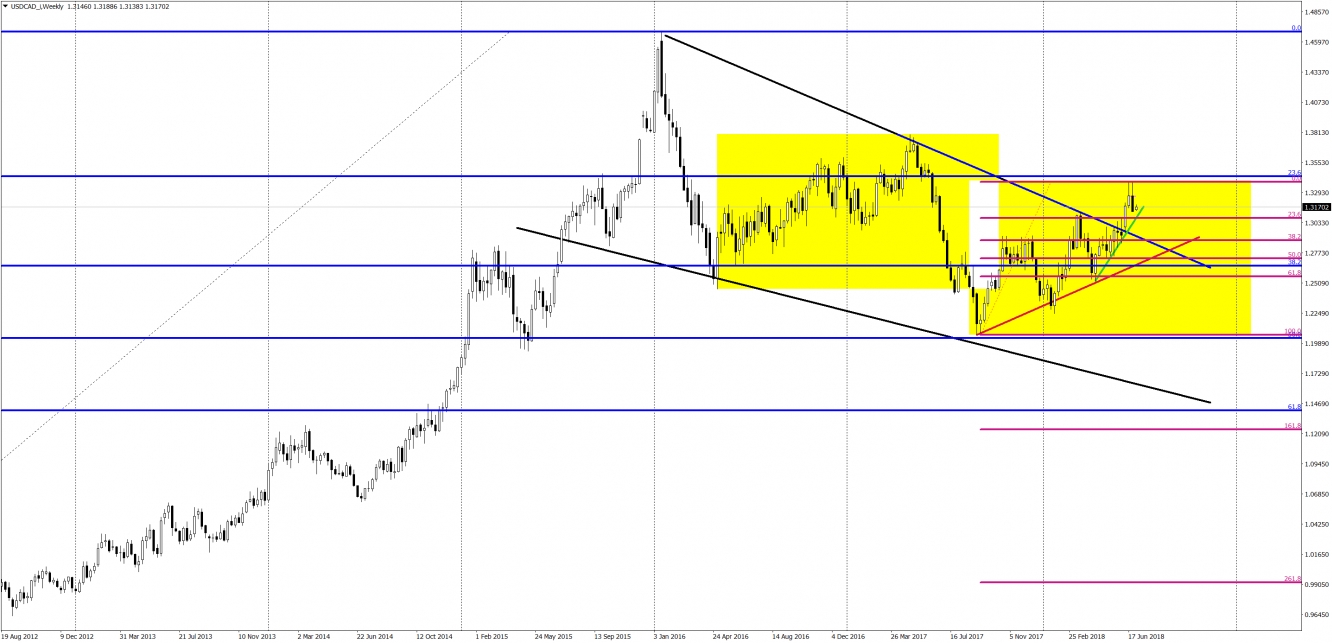
Today, we have something great on the weekly chart, so this is a setup for a long-term, position investors. In this situation, we have everything: price pattern, candlestick pattern and more! All technical factors that I can imagine are pointing south. The hero of the day is: USD/CAD.
First of all, you probably can see the two weekly candles, they are both pinbars bouncing from the long-term horizontal resistance -23,6% Fibonacci. What is more, both of them, create a bearish engulfing pattern, so the second bearish candle is overlapping the first one entirely. In addition to that, the 23,6% Fibo is not the only resistance there. We also do have a correction equality pattern (yellow rectangles). This is rare but very interesting formation, which strengthens us a sell signal. The depth of the correction that lasted from the May 2016 to May 2017 is the same as this one from September 2017 till now ( around 1340 pips). If we go a bit closer, for example to H4 chart, we can see that this bearish engulfing is additionally a double top formation, where the neckline was already broken at the end of June. As I told you, we do have many bearish factors in one place.
The first target for this drop is the red up trendline but according to the price action rules, we should go much lower than that. Drop from the beginning of the 2016 had around 2200 pips and this one from the middle of the 2017 had 1700 pips. Price Action tells us that now we should fall something close to those two numbers, which makes it an awesome trade in terms of the risk to reward ratio.

