🥇 First rule of investing? Know when to save! Up to 55% off InvestingPro before BLACK FRIDAYCLAIM SALE

Next potential targets for Saudi Stock Market (Tadawul)

Published 04/23/2019, 01:07 PM
Updated 07/09/2023, 06:31 AM
TASI
-
GULF
-
KSA
-

Suggested Tags: #KSA #GULF $KSA $GULF #TASI #Tadawul #MidEast #SaudiArabia #StockMarket #TechnicalAnalysis #ETFs #MiddleEast #EmergingMarkets #Oil

April 22, 2019

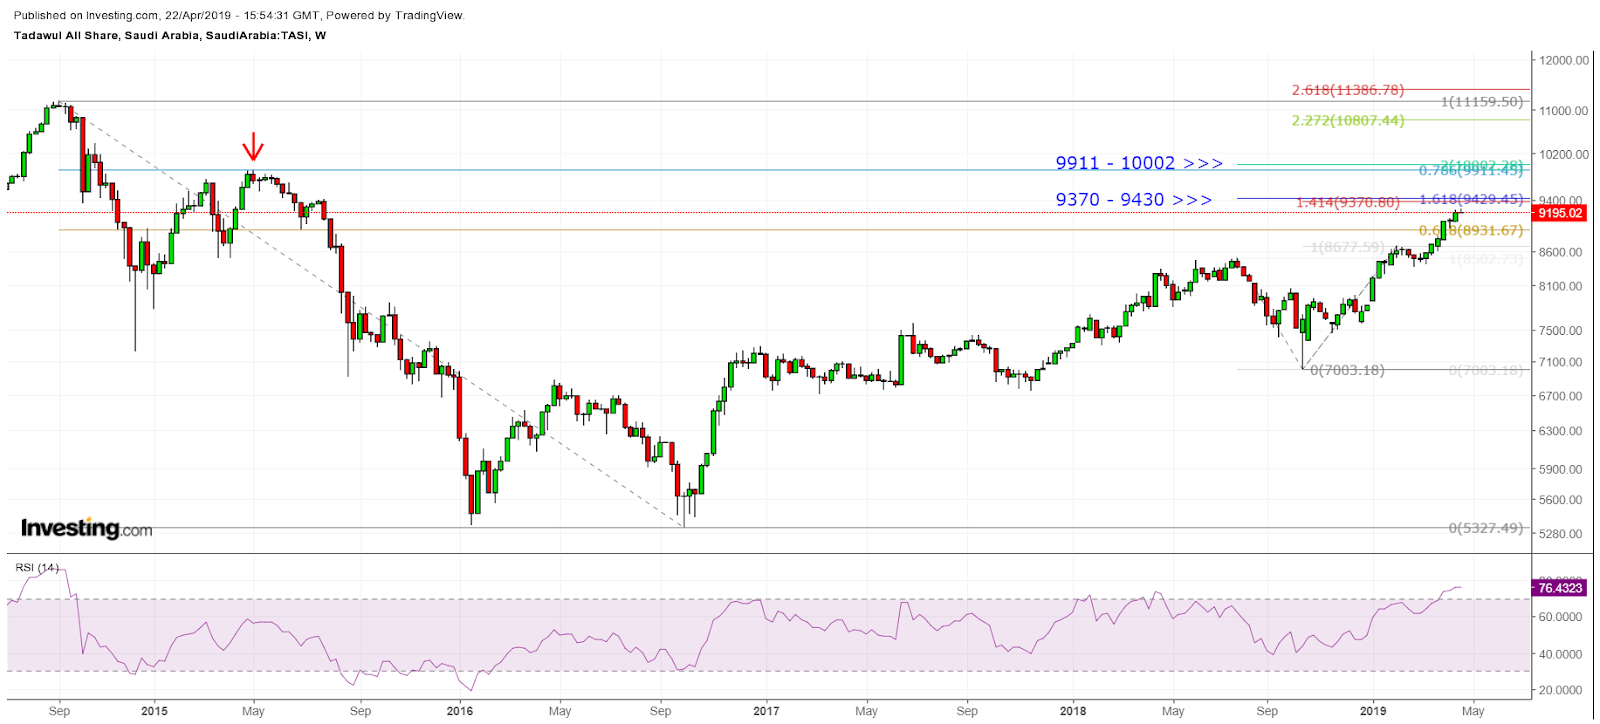
Several weeks ago, the Tadawul All Share index (TASI) went right through the 61.2% Fibonacci retracement (potential resistance) of the long-term downtrend that started off the September 2014 peak of 11,159.50 and kept going. Year-to-date the index is up 17.5%.

Weekly Tadawul All Share Index

Chart powered by TradingView

The next long-term target is around the 9,911 to 10,002, which consists of the 9,897.44 swing high resistance from way back in April 2015. Nevertheless, there is an interim potential resistance zone, comprised of two Fibonacci projection and extension measurements, from around 9,370 to 9,430. Each of these zones can be seen on the accompanying weekly chart of the TASI.

As noted in prior TASI analysis, Investors in US markets can get exposure to Saudi equities through at least two ETFs: iShares MSCI Saudi Arabia ETF (NYSE:KSA) (almost 100% exposure), and Wisdom Tree Middle East Dividend Fund (NASDAQ:GULF) (approximately 27% exposure).

Latest comments

Loading next article…
Risk Disclosure: Trading in financial instruments and/or cryptocurrencies involves high risks including the risk of losing some, or all, of your investment amount, and may not be suitable for all investors. Prices of cryptocurrencies are extremely volatile and may be affected by external factors such as financial, regulatory or political events. Trading on margin increases the financial risks.
Before deciding to trade in financial instrument or cryptocurrencies you should be fully informed of the risks and costs associated with trading the financial markets, carefully consider your investment objectives, level of experience, and risk appetite, and seek professional advice where needed.
Fusion Media would like to remind you that the data contained in this website is not necessarily real-time nor accurate. The data and prices on the website are not necessarily provided by any market or exchange, but may be provided by market makers, and so prices may not be accurate and may differ from the actual price at any given market, meaning prices are indicative and not appropriate for trading purposes. Fusion Media and any provider of the data contained in this website will not accept liability for any loss or damage as a result of your trading, or your reliance on the information contained within this website.
It is prohibited to use, store, reproduce, display, modify, transmit or distribute the data contained in this website without the explicit prior written permission of Fusion Media and/or the data provider. All intellectual property rights are reserved by the providers and/or the exchange providing the data contained in this website.
Fusion Media may be compensated by the advertisers that appear on the website, based on your interaction with the advertisements or advertisers.
© 2007-2024 - Fusion Media Limited. All Rights Reserved.