Nexen Inc. (NXY) is an independent global energy company. The Company’s conventional oil and gas assets consist of large acreage positions in select basins, including the United Kingdom North Sea, deep-water Gulf of Mexico and offshore West Africa.
I found this stock using a real-time custom scan I built in Fidelity. This one hunts for calendar spreads between the front two monthly expiries.
Custom Scan Details
Stock Price GTE $5
Sigma1 - Sigma2 > 7
IV30™ GTE 30
Average Option Volume GTE 1,200
But the real news behind this company occurred on 7-23-2012, when a takeover bid was made and agreed upon. I wrote about that day b/c of some apparent insider trading. You can read that blog here:
Nexen (NXY) - Pre-Takeover Order Flow Looks Like Insider Information; How to Make $32 million (3,200%) in a Week
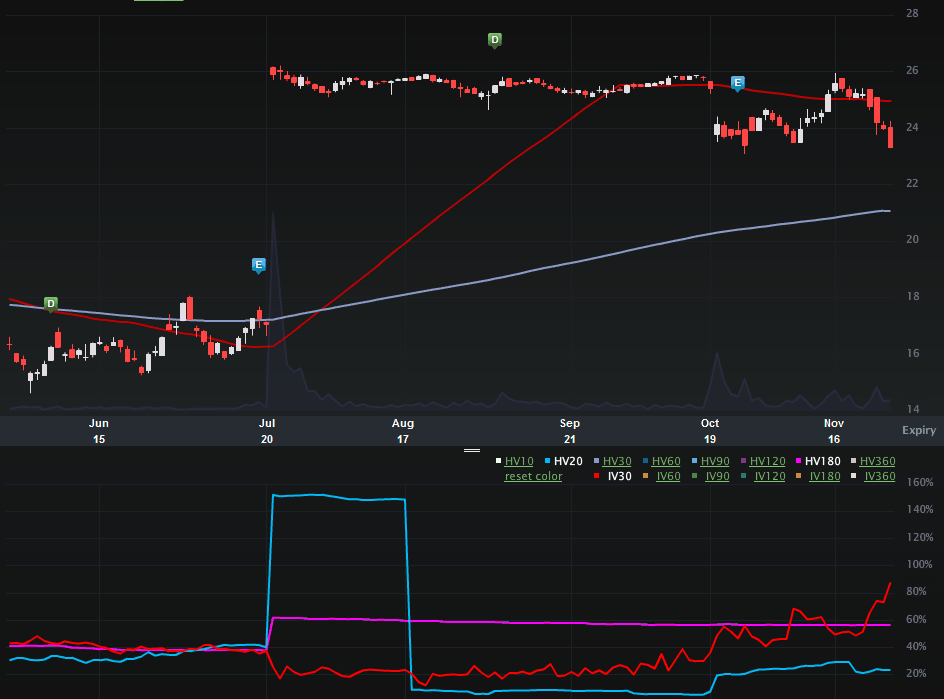
Today I note the rise in vol and even more interesting, the rather dramatic calendar spread that has opened up. Let's start with the six-month Charts Tab, below. The top portion is the stock price the bottom is the vol (IV30™ - red vs HV20™ - blue vs HV180™ - pink).
On the stock side we can see the abrupt gap up on the takeover news and then the quiet period following. I do note the recent stock movement which has moved from absolutely still waters to more bumpy.
On the vol side, the story begins to unfold. Check out the rise in the implied of late. At the time of the takeover announcement IV30™ dipped to 25.88%. Today we can see the implied has risen to nearly 90%. So, a huge increase in risk as reflected by the option market.
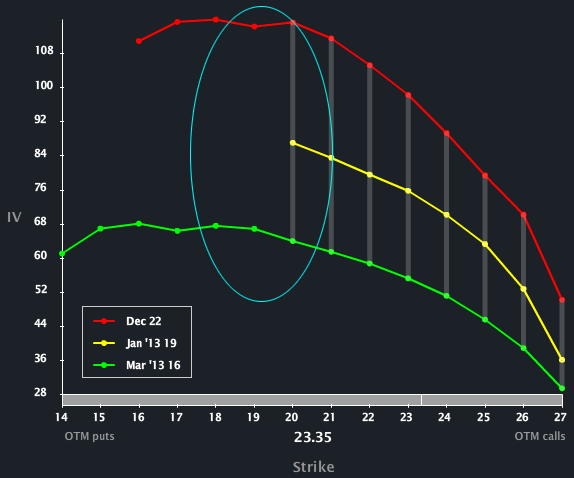
Let's turn to the Skew Tab and we'll see a very interesting term-structure shape.
Note that for all three front expiries the upside skew slopes down, or said differently, the downside risk rises rather abruptly from the upside risk. This happens in a takeover when the upside is capped (the takeover price) but the downside is left open (if the takeover doesn't go through). What's remarkable here is the rather massive vol diff between the front three months -- and in particular between month 1 and month 3. Something is coming up in Dec -- a finalization, a decision, a vote, a something...
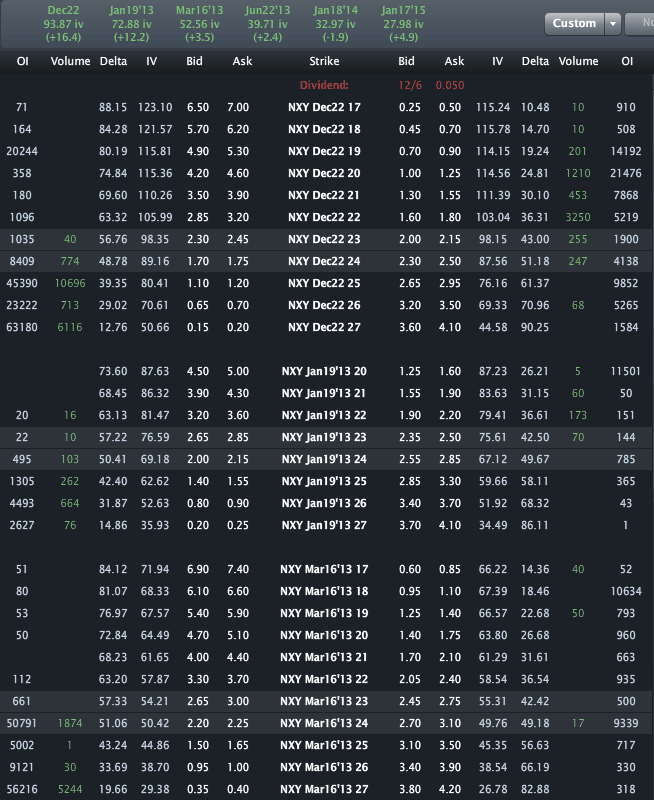
Finally, let's look to the Options Tab (below).
Across the top we can see the monthly vols are priced to 93.87%, 72.88% and 52.56%, respectively for Dec, Jan and Mar. While Dec and Jan overall show a ~21 point vol diff, look at the Dec/Jan 20 put spread -- that shows a 27 vol point diff. Similarly, Dec to Mar shows a ~40 vol point diff, but the Dec/Mar 20 put spread shows ~50 vol point diff. Although the spreads look compelling, this could easily be one where owning the vega in Jan or Mar could be a huge loser with the options literally going to zero if the deal is finalized. Ya know... or not...
Disclosure: This is trade analysis, not a recommendation.
Images provided by Livevol®
- English (UK)
- English (India)
- English (Canada)
- English (Australia)
- English (South Africa)
- English (Philippines)
- English (Nigeria)
- Deutsch
- Español (España)
- Español (México)
- Français
- Italiano
- Nederlands
- Português (Portugal)
- Polski
- Português (Brasil)
- Русский
- Türkçe
- العربية
- Ελληνικά
- Svenska
- Suomi
- עברית
- 日本語
- 한국어
- 简体中文
- 繁體中文
- Bahasa Indonesia
- Bahasa Melayu
- ไทย
- Tiếng Việt
- हिंदी
Nexen: Huge Vol Diff Opens, Implied Rises 250% Since Deal Announcement
Published 11/30/2012, 02:26 AM
Updated 07/09/2023, 06:31 AM
Nexen: Huge Vol Diff Opens, Implied Rises 250% Since Deal Announcement
Latest comments
Loading next article…
Install Our App
Risk Disclosure: Trading in financial instruments and/or cryptocurrencies involves high risks including the risk of losing some, or all, of your investment amount, and may not be suitable for all investors. Prices of cryptocurrencies are extremely volatile and may be affected by external factors such as financial, regulatory or political events. Trading on margin increases the financial risks.
Before deciding to trade in financial instrument or cryptocurrencies you should be fully informed of the risks and costs associated with trading the financial markets, carefully consider your investment objectives, level of experience, and risk appetite, and seek professional advice where needed.
Fusion Media would like to remind you that the data contained in this website is not necessarily real-time nor accurate. The data and prices on the website are not necessarily provided by any market or exchange, but may be provided by market makers, and so prices may not be accurate and may differ from the actual price at any given market, meaning prices are indicative and not appropriate for trading purposes. Fusion Media and any provider of the data contained in this website will not accept liability for any loss or damage as a result of your trading, or your reliance on the information contained within this website.
It is prohibited to use, store, reproduce, display, modify, transmit or distribute the data contained in this website without the explicit prior written permission of Fusion Media and/or the data provider. All intellectual property rights are reserved by the providers and/or the exchange providing the data contained in this website.
Fusion Media may be compensated by the advertisers that appear on the website, based on your interaction with the advertisements or advertisers.
© 2007-2025 - Fusion Media Limited. All Rights Reserved.
