
Newmont Mining Corporation (NYSE:NEM) is engaged in the production of gold, the exploration for gold and the acquisition and development of gold properties worldwide. The company remains focused on investing in projects, explorations and transactions which can improve its resources, reserves and margin. It is also making notable progress with its cost and efficiency improvement programs.
Let’s have a quick look at the company’s third-quarter 2017 release.
Estimate Trend & Surprise History
Investors should note that the earnings estimate for Newmont for the third quarter have been increasing over the past month. The company has beaten the Zacks Consensus Estimate in two of the trailing four quarters, with an average positive surprise of around 14.4%.
Earnings
Newmont’s adjusted earnings for the quarter came in at 35 cents per share. Earnings topped the Zacks Consensus Estimate of 31 cents.
Newmont Mining Corporation Price and EPS Surprise
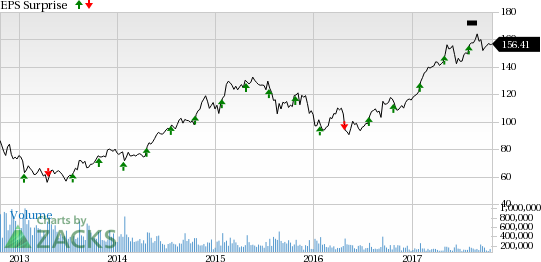
Newmont Mining Corporation Price and EPS Surprise | Newmont Mining Corporation Quote
Revenues
Newmont reported revenues of $1,879 million, up around 4.9% year over year. The figure surpassed the Zacks Consensus Estimate of $1,836 million.
Key Developments to Note
Newmont retained its guidance of attributable gold production in the range of 5–5.4 million ounces for 2017 factoring in full potential improvements in Africa and North America. On year over year comparison, production at Long Canyon and Merian is anticipated to compensate the impact of declines at Yanacocha and Twin Creeks.
The company also kept attributable copper production forecast for 2017 unchanged from the previous guidance of 40,000-60,000 tons per year, including Phoenix and Boddington.
The company kept its AISC (all-in sustaining costs) guidance for 2017 unchanged at between $900 and $950 per ounce, as it expects reduction of sustaining capital in Africa, North America and Australia.
Copper CAS (costs applicable to sales) is estimated in the range of $1.45-$1.65 per pound in 2017. AISC is expected to be between $1.85 and $2.05 per pound in 2017.
Newmont has retained its capital spending guidance for 2017 in the range of $890 million-$990 million, which includes capital for the Northwest Exodus and Tanami expansions, the initial capital for the Ahafo Mill Expansion, Subika Underground, Quecher Main and Twin Underground. This includes sustaining capital expenditure of between $575 million and $675 million.
Zacks Rank
Currently, Newmont has a Zacks Rank #2 (Buy).
Market Reaction
Newmont’s shares were inactive during the pre-market trading. It would be interesting to see how the market reacts to the results during the trading session today.
Check back later for our full write up on Newmont’s earnings report!
Looking for Stocks with Skyrocketing Upside?
Zacks has just released a Special Report on the booming investment opportunities of legal marijuana.
Ignited by new referendums and legislation, this industry is expected to blast from an already robust $6.7 billion to $20.2 billion in 2021. Early investors stand to make a killing, but you have to be ready to act and know just where to look.
See the pot trades we're targeting>>
Newmont Mining Corporation (NEM): Free Stock Analysis Report
Original post