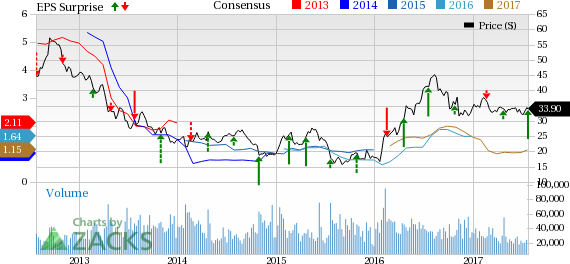
Gold mining giant Newmont Mining Corporation (NYSE:NEM) posted net income from continuing operations of $192 million or 36 cents per share in second-quarter 2017, up from $14 million or 2 cents a share a year ago.
Barring one-time items, adjusted earnings were 46 cents per share for the quarter, outstripping the Zacks Consensus Estimate of 28 cents.
Newmont's revenues of $1,875 million were up 12% from the year-ago quarter due to higher sales volume. The figure beat the Zacks Consensus Estimate of $1,786.8 million.
In the reported quarter, average net realized gold price decreased to $1,250 per ounce from $1,257 an ounce a year ago. The average net realized copper price rose to $2.46 per pound from $2.00 per pound a year ago.
Newmont's attributable gold production increased 13% year over year to 1.4 million ounces in the quarter. The increase can be attributed to production from Long Canyon and Merian, offsetting lower grades at Yanacocha and Tanami.
Newmont’s gold costs applicable to sales (CAS) was $644 per ounce for gold in the quarter, almost remained unchanged from year-ago quarter of $661. Copper CAS in the reported quarter was $1.38 per pound, an increase of 27% year over year, on the back of full potential improvements, higher sales volumes and lower co-product allocation of costs to copper.
All-in sustaining costs (AISC) of $884 per ounce for gold fell roughly 3.2% year over year while $1.69 per pound for copper was down almost 22% year over year on improved unit CAS.
Regional Performance
North America
Attributable gold production in North America in the second quarter was 578,000 ounces, rising 21% year over year. Consolidated copper production was at 5,000 tons, unchanged figure recorded in the year-ago quarter.
Gold CAS for the region was $628 per ounce, down 10% year over year, and copper CAS was $1.60 per pound, declining 21% year over year.
South America
Attributable gold production in South America was 153,000 ounces, surging 89% year over year. Gold CAS for this region rose 7% year over year to $825 per ounce.
Australia
Attributable gold and copper production in the region was 401,000 ounces, declining 7% year over year. Gold and copper CAS for this region was $652 per ounce, up 5%, and $1.27 per pound, down 31%, respectively.
Africa
The region produced 220,000 ounces of gold in the reported quarter, up 7% year over year. Gold CAS was $605 per ounce, increasing 8% year over year.
Financial Position
Net cash provided by continuing operating activities declined 21% year over year to $529 million in the second quarter, mainly due to working capital changes. The company ended the quarter with $3.1 billion cash in hand.
The company reduced net debt by over 70% to $1.5 billion.
Outlook
Newmont revised its guidance of attributable gold production to the range of 5–5.4 million ounces for 2017 (up from 4.9–5.4 million ounces). Production at Long Canyon and Merian is anticipated to compensate the impact of declines at Yanacocha and Twin Creeks.
The company kept attributable copper production forecast for 2017 unchanged from the previous guidance of 40,000–60,000 tons per year.
The company revised its AISC guidance for 2017 and it now expects it to be between $900 and $950 per ounce (down from $940 and $1,000 per ounce expected earlier).
Copper CAS is estimated in the range of $1.45–$1.65 per pound in 2017. AISC is expected to be between $1.85 and $2.05 per pound in 2017.
Over the longer term, Copper CAS is expected between $1.5 and $1.9 per pound, and copper AISC is expected to be between $1.85 and $2.25 per pound.
Newmont has revised downward its capital spending guidance for 2017 to the range of $890 million – $990 million (down from $900 million – $1.1 billion). This includes sustaining capital expenditure of between $575 million and $675 million (down from $600 million and $700 million expected earlier).
Price Performance
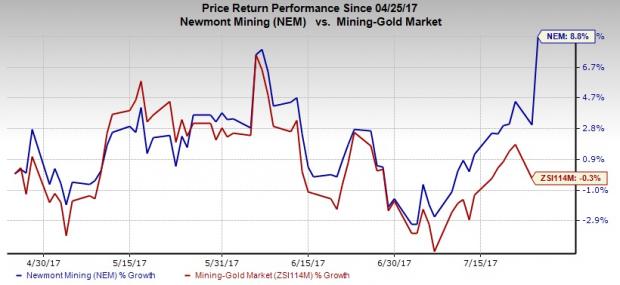
Newmont shares have gained 8.8% in the last three months versus the 0.3% decline of its industry.

Zacks Rank & Key Picks
Newmont currently carries a Zacks Rank #3 (Hold).
Some better-ranked companies in the basic materials space include The Sherwin-Williams Company (NYSE:SHW) , Ternium S.A. (NYSE:TX) and Westlake Chemical Corporation (NYSE:WLK) . All three stocks sport a Zacks Rank #1 (Strong Buy). You can see the complete list of today’s Zacks Rank #1 stocks here.
Sherwin-Williams has expected long-term earnings growth rate of 11.4%.
Ternium has expected long-term earnings growth rate of 18.4%.
Westlake Chemical has expected long-term earnings growth rate of 7.15%.
More Stock News: Tech Opportunity Worth $386 Billion in 2017
From driverless cars to artificial intelligence, we've seen an unsurpassed growth of high-tech products in recent months. Yesterday's science-fiction is becoming today's reality. Despite all the innovation, there is a single component no tech company can survive without. Demand for this critical device will reach $387 billion this year alone, and it's likely to grow even faster in the future.
Zacks has released a brand-new Special Report to help you take advantage of this exciting investment opportunity. Most importantly, it reveals 4 stocks with massive profit potential. See these stocks now>>
Westlake Chemical Corporation (WLK): Free Stock Analysis Report
Newmont Mining Corporation (NEM): Free Stock Analysis Report
Sherwin-Williams Company (The) (SHW): Free Stock Analysis Report
Ternium S.A. (TX): Free Stock Analysis Report
Original post
Zacks Investment Research

