New Highs For Gold, Yet Is Trouble Brewing

Published 04/18/2017, 08:41 AM
Updated 05/14/2017, 06:45 AM
XAU/USD
-
GC
-

Since making a bottom in late December, gold is up over $150, more than 10%. The latest move up from a low at the Ides of March has added nearly $100 of that. Gold is moving higher. Everyone is on board and the goldbugs are getting loud and excited. But all may not be well with the shiny yellow rock, and it is the Japanese that are telling why.

Japanese candlesticks that is. Each candlestick in the chart below represents a day of price action in gold. This type of chart is crowded with information as each candlestick gives a clear view of the open, high, low and closing price. It can show intraday trends. And what is showing up over the last 3 days is possible trouble in the gold paradise.
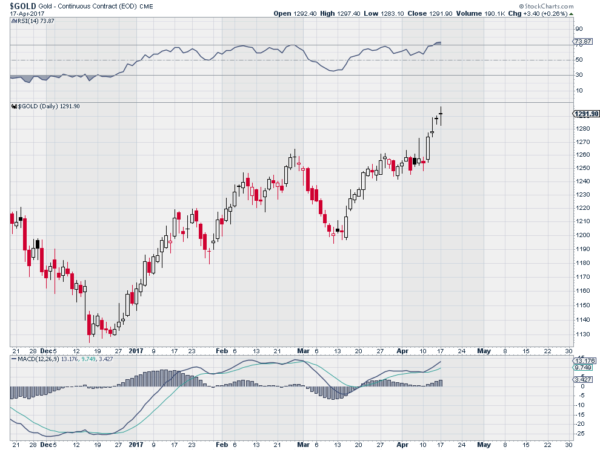
Gold Daily Chart

Each of the last 3 days gold has printed what is known as a doji. This is where the open and close are at the same price. These are indecision candles because they show an open and move in one direction followed by a reversal and move in the opposite direction, and finally a move back to the opening price to end the day. Both buyers and sellers tried to assert themselves and neither was able to do so as the other overwhelmed them. Indecision.

When these doji candlestick happen after a trend run to the upside they are thought to be a signal that the move is ended and possibly about to reverse. You can see the same candlesticks at the end of February that led to a move lower. This time may be different as indecision can resolve in either direction, with buyers or sellers prevailing. But momentum indicators on the chart suggest that one watch for the reversal. The RSI is in overbought territory. Both the RSI and the MACD are at levels where the price has reversed in the past. It is time to watch gold more closely.

DISCLAIMER: The information in this blog post represents my own opinions and does not contain a recommendation for any particular security or investment. I or my affiliates may hold positions or other interests in securities mentioned in the Blog, please see my Disclaimer page for my full disclaimer.

Original post

Latest comments

Loading next article…
Risk Disclosure: Trading in financial instruments and/or cryptocurrencies involves high risks including the risk of losing some, or all, of your investment amount, and may not be suitable for all investors. Prices of cryptocurrencies are extremely volatile and may be affected by external factors such as financial, regulatory or political events. Trading on margin increases the financial risks.
Before deciding to trade in financial instrument or cryptocurrencies you should be fully informed of the risks and costs associated with trading the financial markets, carefully consider your investment objectives, level of experience, and risk appetite, and seek professional advice where needed.
Fusion Media would like to remind you that the data contained in this website is not necessarily real-time nor accurate. The data and prices on the website are not necessarily provided by any market or exchange, but may be provided by market makers, and so prices may not be accurate and may differ from the actual price at any given market, meaning prices are indicative and not appropriate for trading purposes. Fusion Media and any provider of the data contained in this website will not accept liability for any loss or damage as a result of your trading, or your reliance on the information contained within this website.
It is prohibited to use, store, reproduce, display, modify, transmit or distribute the data contained in this website without the explicit prior written permission of Fusion Media and/or the data provider. All intellectual property rights are reserved by the providers and/or the exchange providing the data contained in this website.
Fusion Media may be compensated by the advertisers that appear on the website, based on your interaction with the advertisements or advertisers.
© 2007-2025 - Fusion Media Limited. All Rights Reserved.