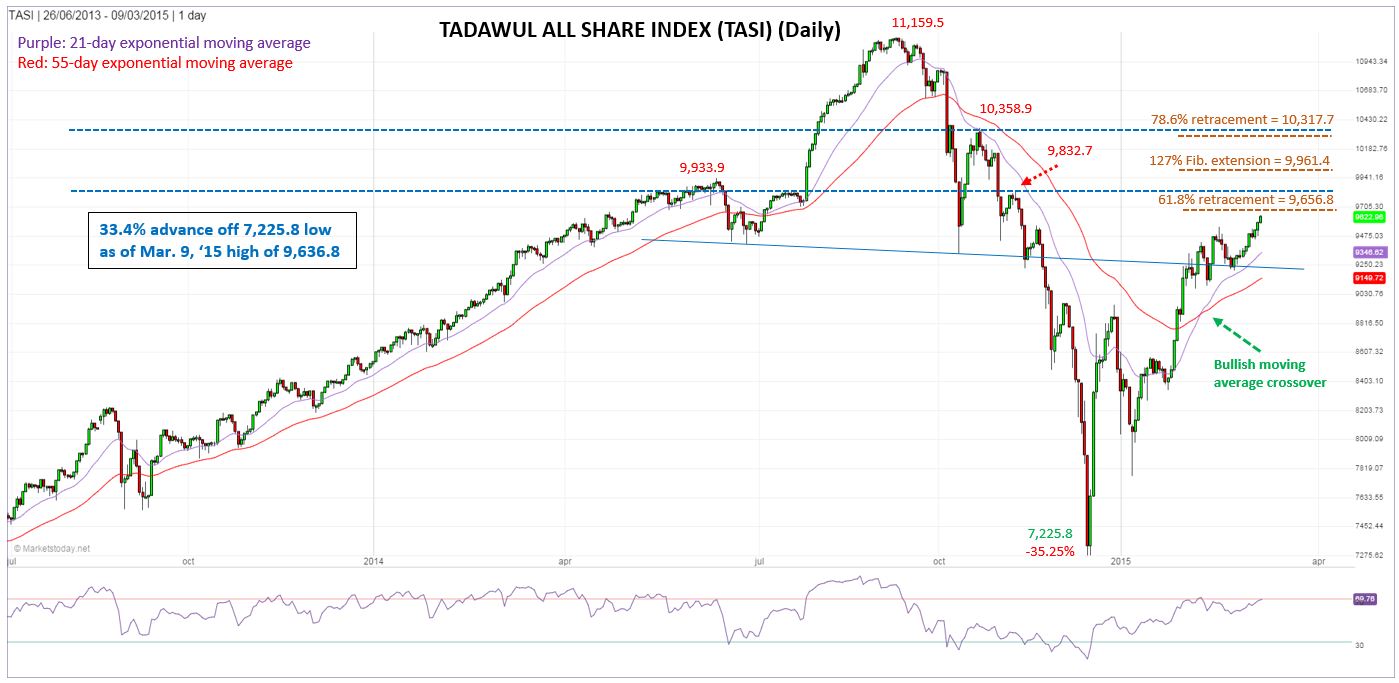
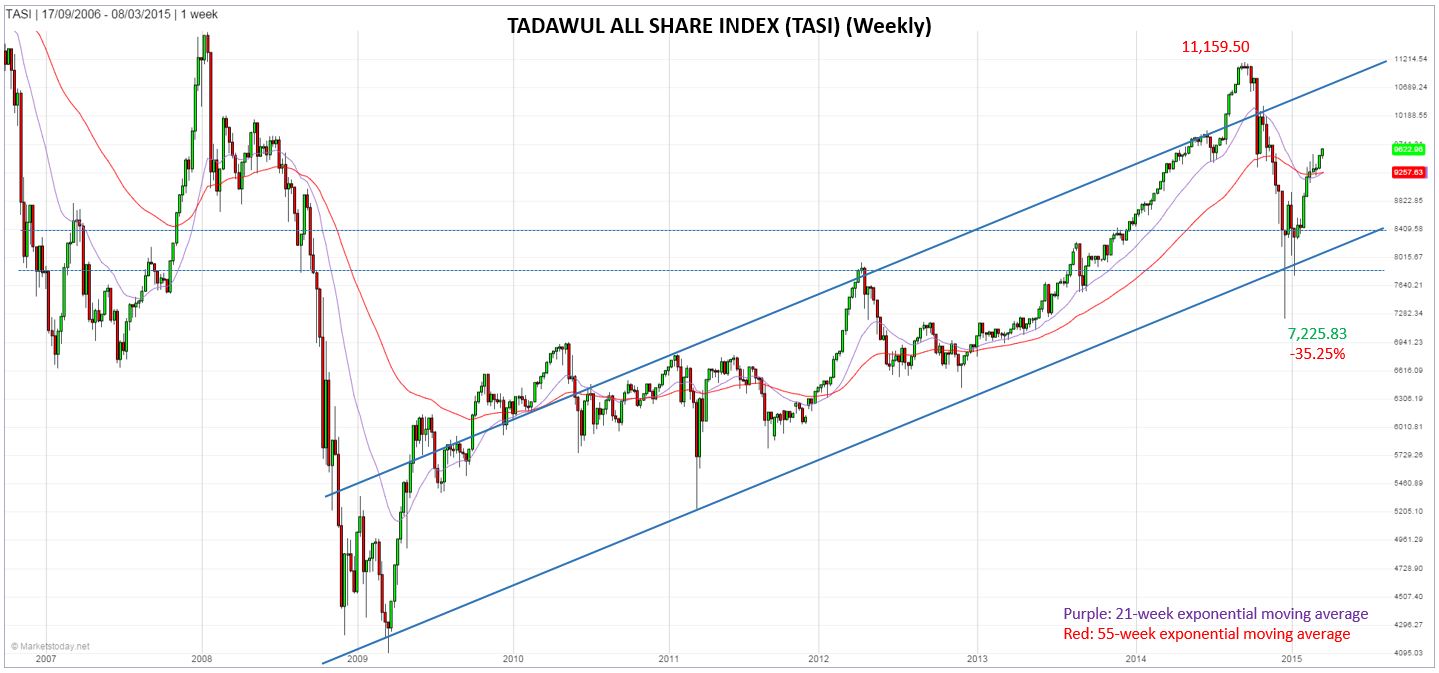
On Sunday, the Tadawul All Share Index (TASI) exceeded its prior swing high of 9,544.5, and triggered a continuation of the 12-week uptrend. Strength continued into Monday as the TASI closed up 43.68 or 0.46% to end at 9,622.96. To date the TASI has gained 33.4% from its December 17, 2014 low of 7,225.8, almost matching the prior move in the opposite direction on a percentage basis. Other bullish signs include the 21-exponential moving average (ema) crossing above the 55-day ema in early-February, and that the RSI momentum oscillator has not yet reached overbought territory (now at 69.76).

A 61.8% Fibonacci retracement of the 35.25% decline from last year completes at 9,656.8, which is the next area of potential resistance. That price level is followed by two potential resistance zones, first around 9,832.7 (two prior peaks), and then in the area of the previous 9,933.9 peak from last October.
If the higher peak is exceeded, then next watch the 9,961.4 price area for resistance. That’s where the second leg up off the December 2014 low is a 127% extension of the first leg up. Higher still is a resistance zone from approximately 10,317.7 to 10,358.9, consisting of the 78.6% Fibonacci retracement and the prior peak from late-October 2014, respectively.

The weekly trend can be anticipated to continue higher until there are signs of weakening. At this point, that doesn’t occur until there is a drop below and subsequent daily close below this week’s low of 9,474.75.
Technical Summary:
- 9,656.8: 61.8% Fibonacci retracement
- 9,833: two prior peaks
- 9,934: previous peak
- 9,961.4: 2nd leg up off the 7,225.8 low = 127.2% Fibonacci extension of the first leg up
- 21-day ema crossed above 55-day ema in early-February
- 21-week ema is just about to cross above 55-week ema
- Not yet overbought: RSI is at 69.76 (overbought = > 70)
