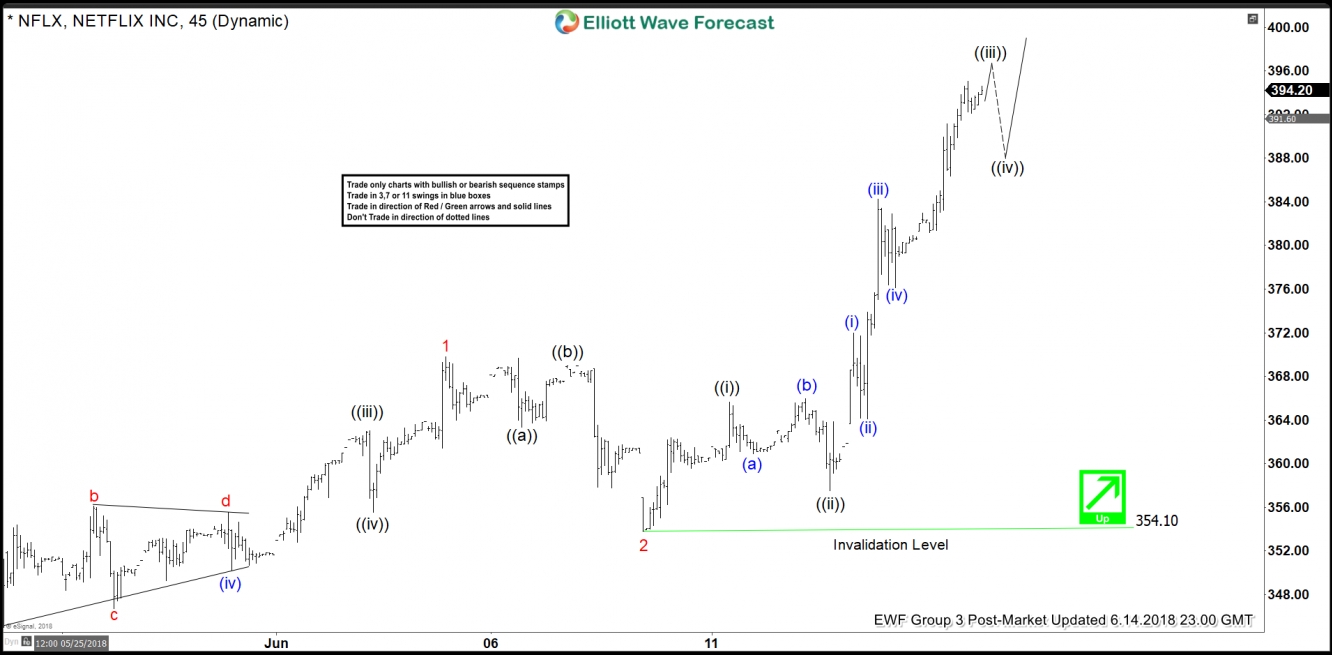
Netflix (NASDAQ:NFLX) ticker symbol: $NFLX short-term Elliott wave view suggests that the rally to $369.83 high on 6/05/2018 ended Minor wave 1. The internals of that rally unfolded as Elliott wave impulse structure with lesser degree 5 waves structure in Minute wave ((i)), ((iii)), and ((v)). Below from $369.83, the decline to $354.10 low on 6/08/2018 ended Minor wave 2 pullback.
The internals of that pullback unfolded as Elliott wave Flat structure where Minute wave ((a)) ended in 3 swings at $363.33. Minute wave ((b)) ended in another 3 waves at $368.99 and Minute wave ((c)) ended in 5 waves at $354.10 low. Up from there, Minor wave 3 remains in progress into another 5 waves impulse structure and already showing higher high sequence in the stock. The internal degree Minute wave ((i)) of 3 completed at $365.67 & Minute wave ((ii)) of 3 completed at $357.50 low.
Near-term Minute wave ((iii)) of 3 is expected to complete soon in 5 wave structure. Afterwards, the stock is expected to do a pullback in Minute wave ((iv)) of 3 in 3, 7 or 11 swings. The stock then should do another push higher towards $401 – $430.2, which is 100%-161.8% Fibonacci extension area of Minor wave 1-2. The move higher should complete 5 waves structure and also end cycle from 6/8/2018 low ($354.10). We don’t like selling it and intraday dips should find buyers in 3, 7 or 11 swings.
Netflix 1 Hour Elliott Wave Chart


