NetApp, Inc. (NTAP) is a provider of storage and data management solutions. The Company has a portfolio of application, virtualization, cloud, and service provider solutions. NetApp’s products and services are designed to meet the requirements and service levels of enterprises and their business applications.
The stock just came up on a real-time custom scan. This one hunts for calendar spreads between the front two months.
Custom Scan Details
- Stock Price GTE $5
- Sigma1 - Sigma2 GTE 8
- Average Option Volume GTE 1,000
- Industry isNot Bio-tech
- Days After Earnings GTE 5 LTE 70
- Sigma1, Sigma2 GTE 1
The goal with this scan is to identify back months that are cheaper than the front by at least 8 vol points. I'm also looking for a reasonable amount of liquidity in the options (thus the minimum average option volume), want to avoid bio-techs (and their crazy vol) and make sure I'm not selling elevated front month vol simply because earnings are approaching.
ANALYSIS
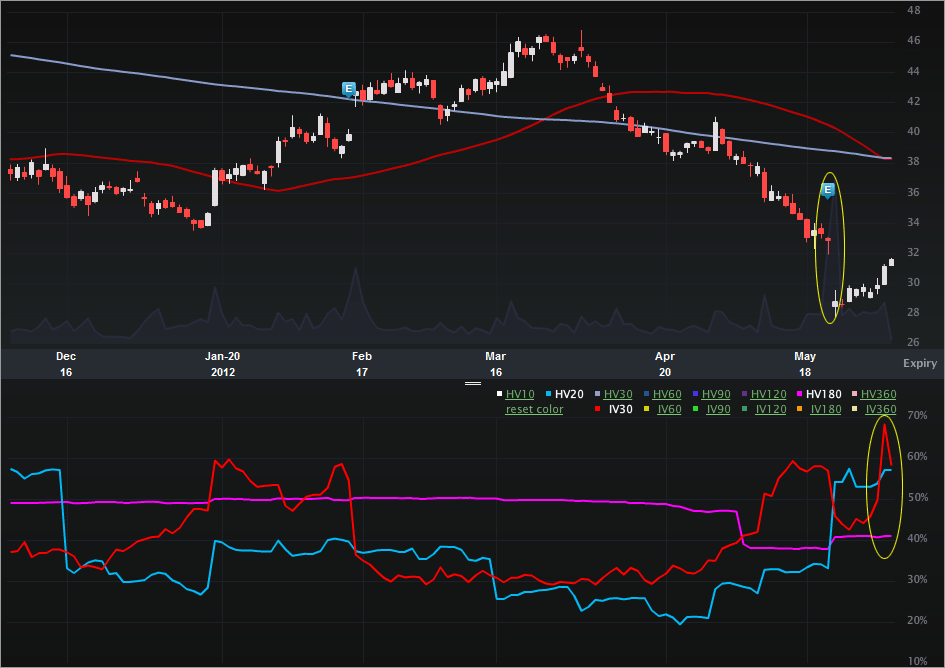
Let’s start with the Charts Tab (six months), below. The top portion is the stock price, the bottom is the vol (IV30™ - red vs HV20™ - blue vs HV180™ - pink).
On the stock side, we can see the recent gap down off of earnings. The stock dropped from $32.86 on 5-23-2012 to $28.82 the next day on lower guidance. Since then, however, the stock has recovered a bit to $31.60 as of this writing.
On 6-4-2012, Bloomberg came out with an article entitled, “NetApp Near Record-Low Value May Lure Suitors: Real M&A,” written by Tara Lachapelle and Peter Burrows on Jun 4, 2012 1:15 PM PT. You can get to the article by clicking here. The title kinda says it all and it seems that IBM and ORCL have emerged as potential bidders. With this news out there, there is this sort of weird phenomenon where lower NTAP prices might make the price then go higher… if that makes any sense.
On the vol side we can see a steep decline off of earnings (normal), and then a rather abrupt rise after. Today vol is down nearly 15%, though I’m not sure why.
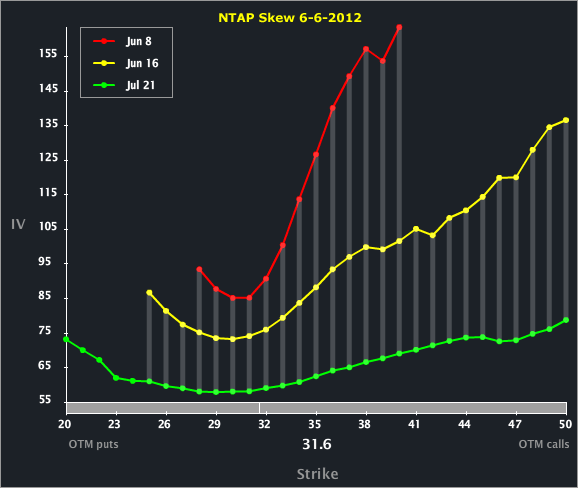
Let’s turn to the Skew Tab to examine the calendar vol diff that the custom scan identified.
We can see two phenomena quite clearly from the skew chart:
1. There is a monotonic vol increase from the back to the front across the front three expiries.
2. There is an upside skew across all three front expiries to the OTM calls. In English, the option market reflects greater upside risk (potential) than downside risk.
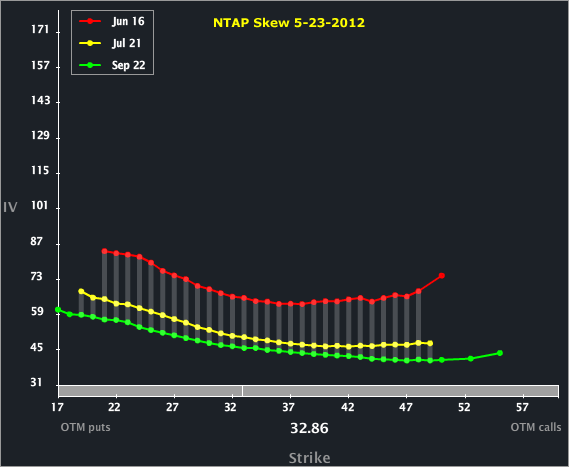
I’ve included the Skew Tab as of 5-23-2012 (earnings were announced that day AMC).
The vol diff between the months is normal due to earnings, but note that the shape of the skews is flatter than we see today. The stock drop and the potential for a takeover seem to be affecting the skew shape, and more specifically, the price of the OTM calls.
SUMMARY
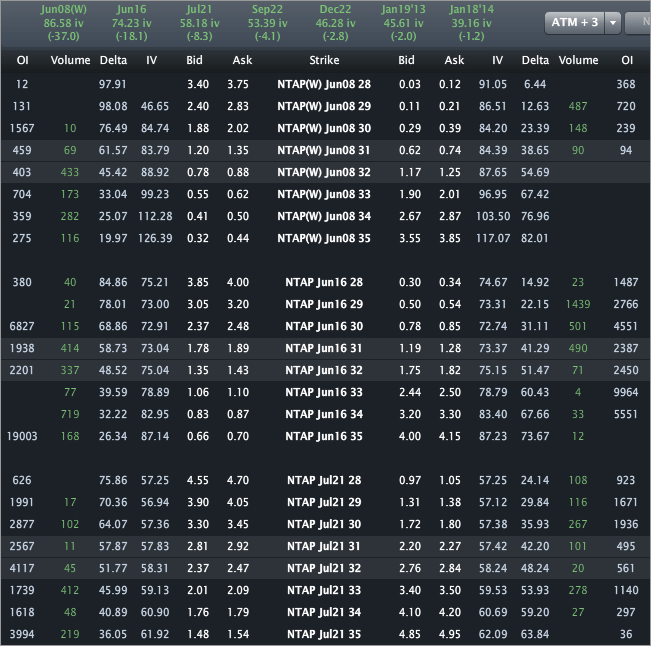
Finally, let’s turn to the Options Tab, for completeness.
I wrote about this one for TheStreet.com (OptionsProfits), so no specific trade analysis here. Across the top we can see the vols by expiry with 86.58%, 74.23 and 58.18% for Jun08(W), Jun monthly and Jul monthly, respectively. I make particular note of that upside vol diff between the front expiry (the weeklies) and either of the back two.
Disclaimer: This is trade analysis, not a recommendation
