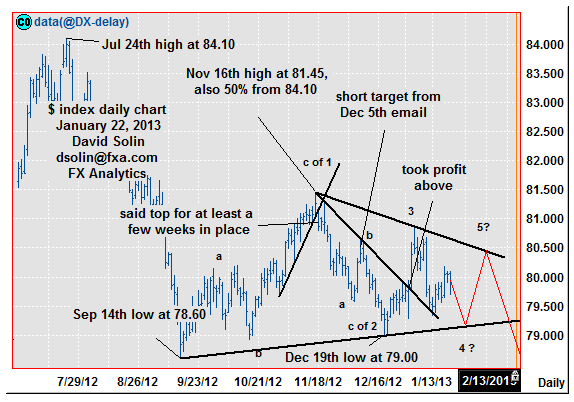
No change as the market continues to trade in a tighter and tighter range since the Sept 14th low at 78.60, still seen forming a contracting triangle/pennant over that time. These are seen as continuation patterns suggesting an eventual downside resolution (but further big picture downside may be limited, see longer term below). However, they break down to 5 legs, arguing another week (or more) of ranging within the pattern first (see "ideal" scenario in red on daily chart below). Support is seen at last week's 79.35 low and the base of the triangle (currently at 79.00/10), resistance is seen at 80.15/25 and the ceiling (currently at 82.65/75).
Strategy/position:
As these triangle patterns form, there is little in the way of "net" market progress. However, decent profits can often be made by trading with a shorter term bias, fading the extremes of the pattern, and then being aggressive with trailing stops to maintain a good overall risk/reward. Can take this approach, but in regards to specific recommendations for this email, the timeframe is just too short. So for the email, would be patient but looking to short once the confidence of an approaching resolution of the triangle (likely near the ceiling) increases.
Long term outlook:
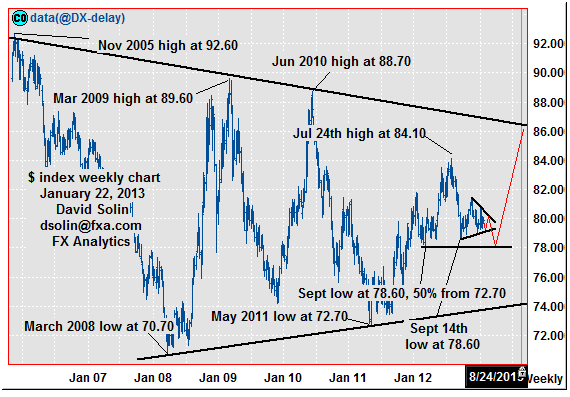
As discussed above, an eventual downside resolution to the multi-month triangle is favored. However, such a move lower may be limited and part of a more major bottoming, and not the start of a more significant down move (see "ideal" scenario in red on weekly chart/2nd chart below). Don't forget that the resolution of these triangle patterns is generally the final leg in a larger move (down in this case, and in Elliott Wave terms the pattern occurs in wave 4 or B) and the market remains within an even larger triangle since Nov 2005 with eventual gains to the ceiling (currently at 86.60/75) favored. Additionally, key, longer term resistance lies just below the 78.60 low in the 78.10/40 area (March low, 50% retracement from the May 2011 low), and with all adding to the view that further lows below 78.60 may indeed be limited.
Strategy/position:
Still a longer term bull but with a downside resolution of the triangle (and final downleg) favored, would be a bit more patient before switching the bias from neutral back to the bullish side.
Near term : fade extremes of multi-month triangle, but with eventual down resolution favored.
Last : sold Dec 7 at 80.45, too profit Jan 2 above t-line from Nov (79.80, closed 79.85 for 60 ticks).
Longer term : neutral Dec 24 at 79.50 from bull Nov 5 at 80.75, but looking to switch back ahead.
Last: : bull bias Mar 12 at 80.05 to neutral Aug 6th at 82.30, another month or 2 of wide chop.

- English (UK)
- English (India)
- English (Canada)
- English (Australia)
- English (South Africa)
- English (Philippines)
- English (Nigeria)
- Deutsch
- Español (España)
- Español (México)
- Français
- Italiano
- Nederlands
- Português (Portugal)
- Polski
- Português (Brasil)
- Русский
- Türkçe
- العربية
- Ελληνικά
- Svenska
- Suomi
- עברית
- 日本語
- 한국어
- 简体中文
- 繁體中文
- Bahasa Indonesia
- Bahasa Melayu
- ไทย
- Tiếng Việt
- हिंदी
Nearer Term Dollar Index Outlook
Published 01/23/2013, 02:38 AM
Updated 07/09/2023, 06:31 AM
Nearer Term Dollar Index Outlook
Latest comments
Loading next article…
Install Our App
Risk Disclosure: Trading in financial instruments and/or cryptocurrencies involves high risks including the risk of losing some, or all, of your investment amount, and may not be suitable for all investors. Prices of cryptocurrencies are extremely volatile and may be affected by external factors such as financial, regulatory or political events. Trading on margin increases the financial risks.
Before deciding to trade in financial instrument or cryptocurrencies you should be fully informed of the risks and costs associated with trading the financial markets, carefully consider your investment objectives, level of experience, and risk appetite, and seek professional advice where needed.
Fusion Media would like to remind you that the data contained in this website is not necessarily real-time nor accurate. The data and prices on the website are not necessarily provided by any market or exchange, but may be provided by market makers, and so prices may not be accurate and may differ from the actual price at any given market, meaning prices are indicative and not appropriate for trading purposes. Fusion Media and any provider of the data contained in this website will not accept liability for any loss or damage as a result of your trading, or your reliance on the information contained within this website.
It is prohibited to use, store, reproduce, display, modify, transmit or distribute the data contained in this website without the explicit prior written permission of Fusion Media and/or the data provider. All intellectual property rights are reserved by the providers and/or the exchange providing the data contained in this website.
Fusion Media may be compensated by the advertisers that appear on the website, based on your interaction with the advertisements or advertisers.
© 2007-2025 - Fusion Media Limited. All Rights Reserved.
