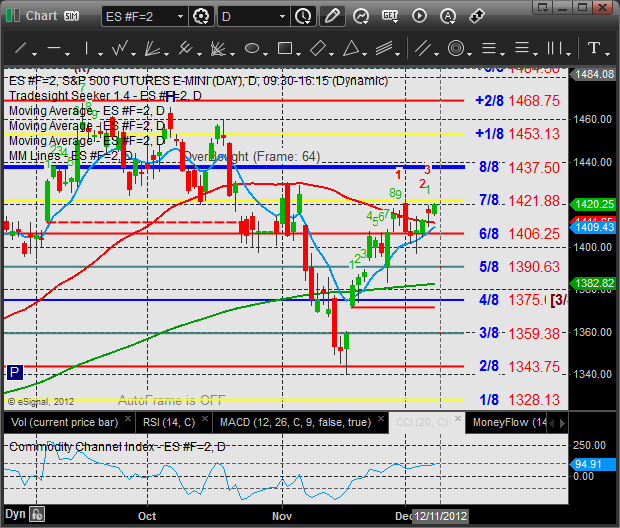
The ES was higher on the day by 4 handles, nominally expanding the upside of the recent range on a low volume day. While the day was unimpressive internally, this is the first session of the move that where the close settled above the open.
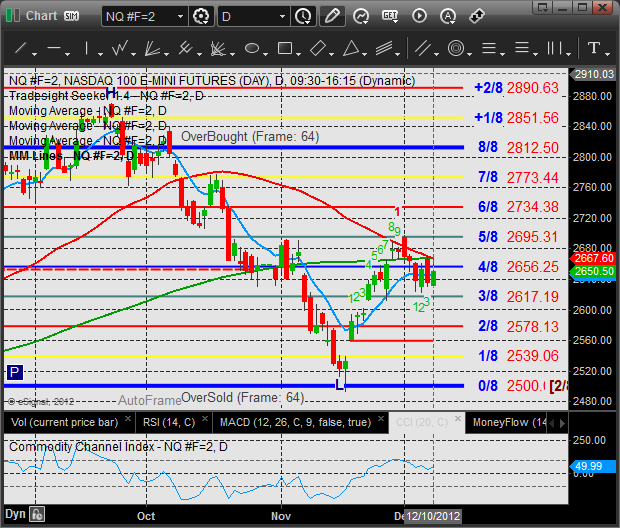
The NQ futures put in a similar relative performance to the SP but still have a very different technical setup as price remains below the 50 and 200dma’s. The Relative weakness in the NQ side will be discussed in more detail below. Keep a close eye on the key 4/8 Gann level just abovfe.
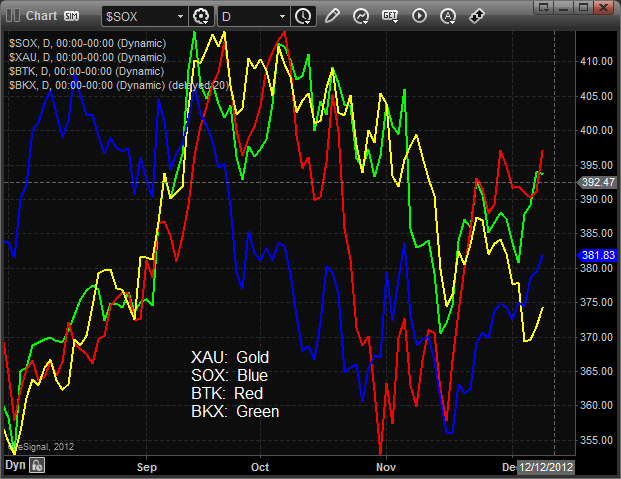
Multi sector daily chart:
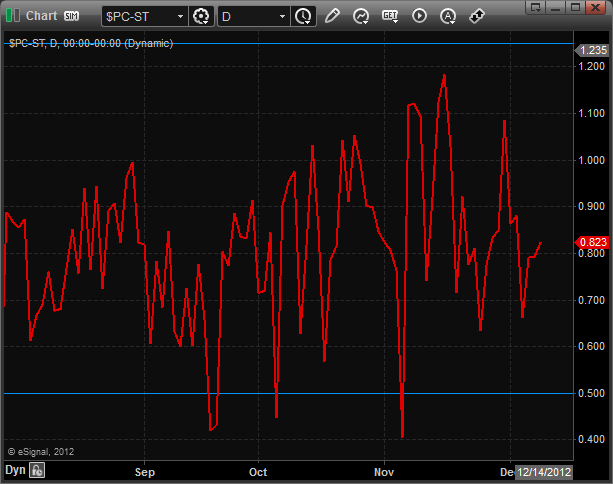
Total put/call ratio:
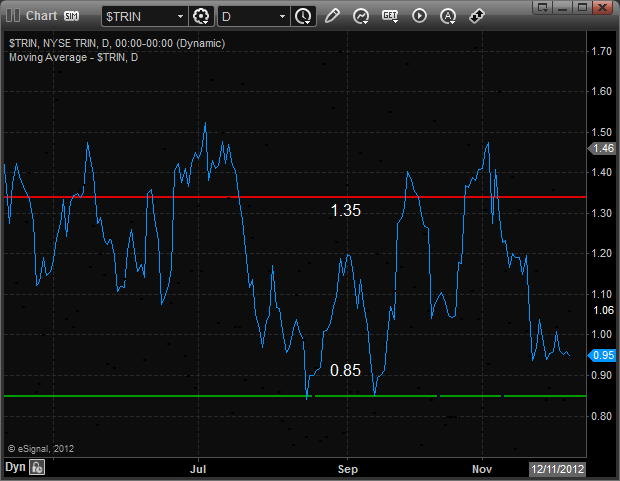
The 10-day Trin remains neutral:
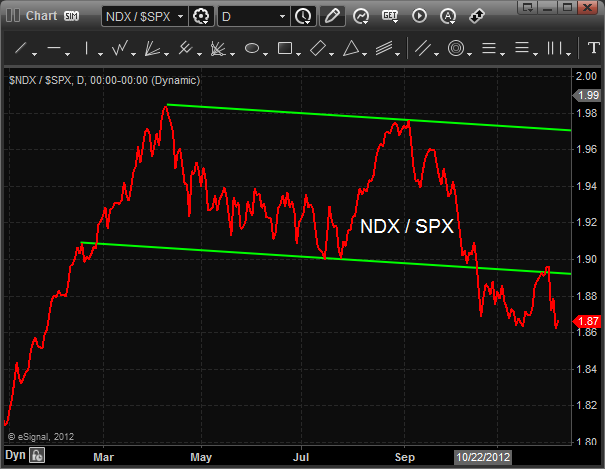
The NDX has had persistent weakness vs. the SPX side since mid-September. This is a clear warning sign and a classic intermarket divergence. This condition needs to be rectified or it will surely hold back the overall broad market. Note the attempt to break back into the trend channel and rejection.
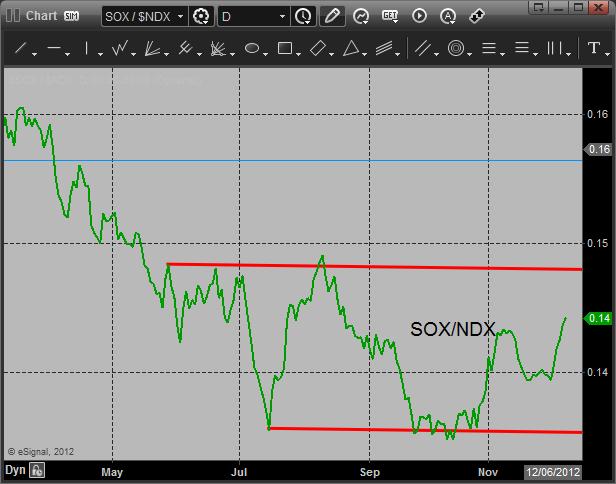
While the NDX tends to lead the SPX within the NDX there is a key leading component the SOX. As described above the NDX has relative weakness but the SOX has been improving after not making a new relative low. If the SOX can get back above the trend channel, then the NDX will have its trend leading component in a bullish position of relative strength.
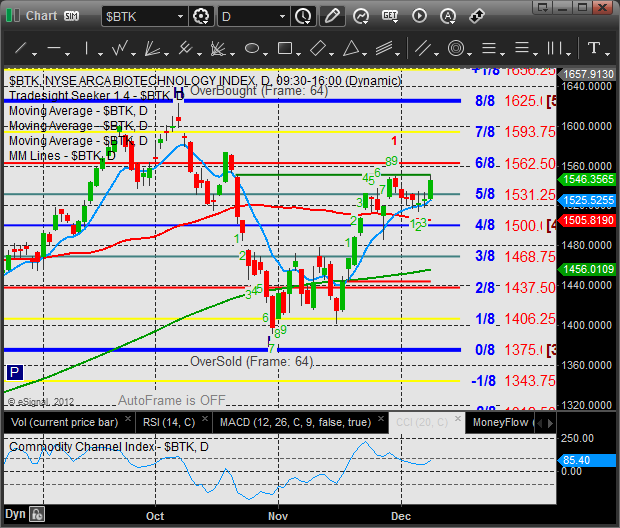
The BTK was the top Naz sector, once again challenging the active static trend line.
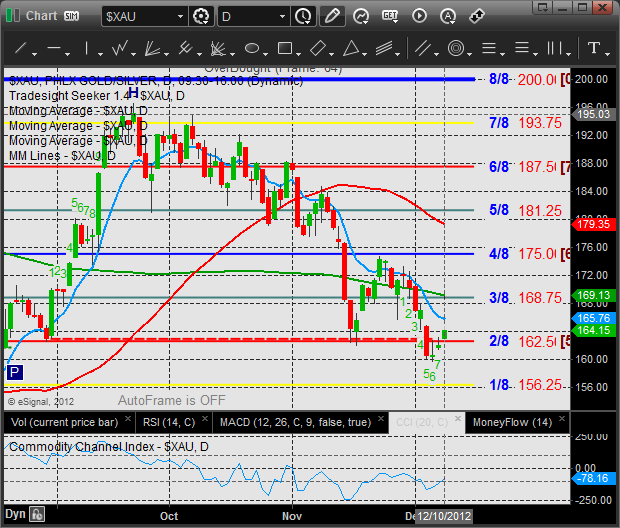
The XAU is bouncing off a short-term oversold condition.
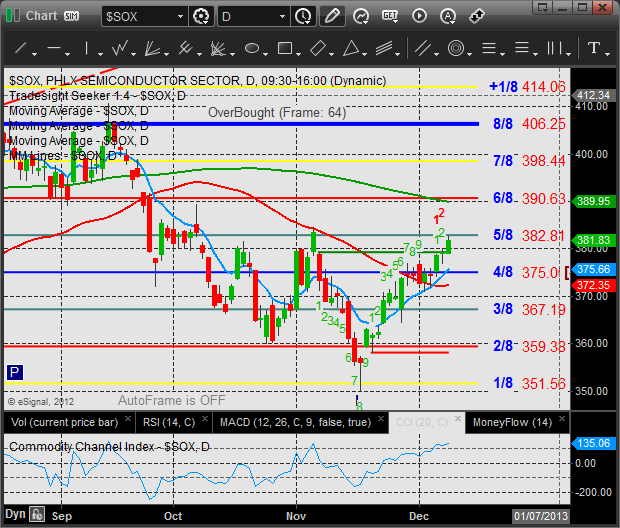
The SOX has settled above the static trend line and is now on the north side of the 10ema and 50dma. The next challenge will be the 200dma if it can clear relatively minor 5/8 Murrey math level.
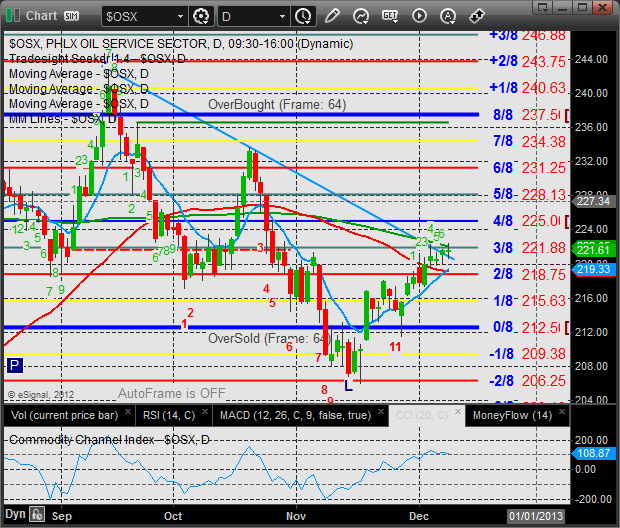
The OSX is still grinding in the area of the active DTL:
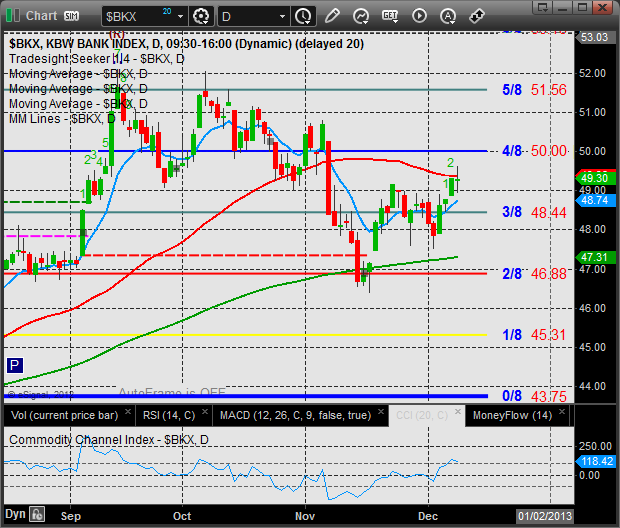
The BKX was a laggard and is still contained by the 50dma:
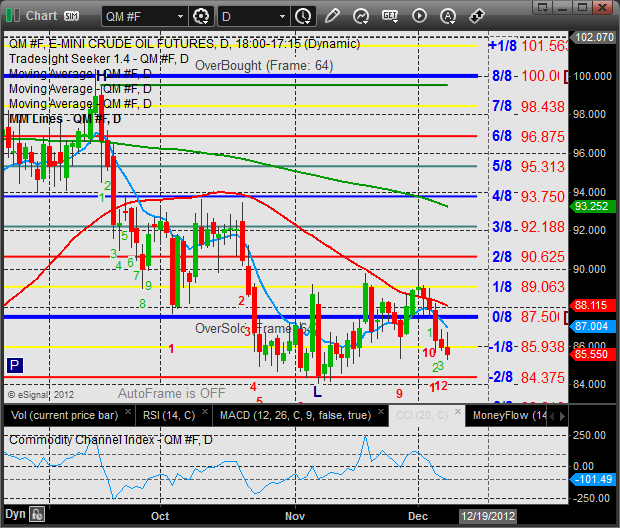
If oil moves just a bit lower it will record a Seeker exhaustion buy:
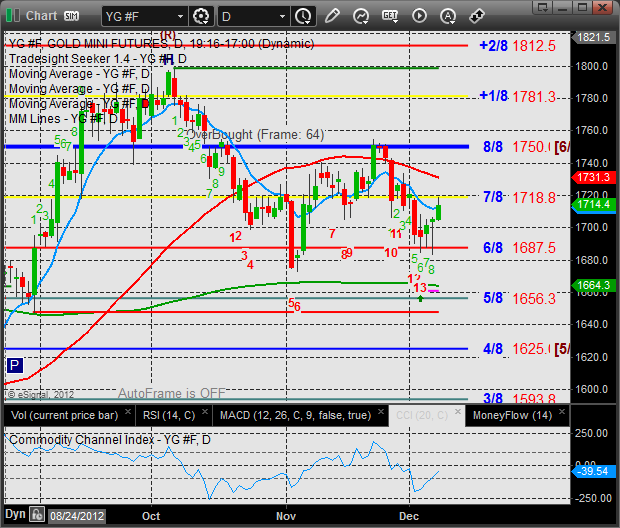
Gold:
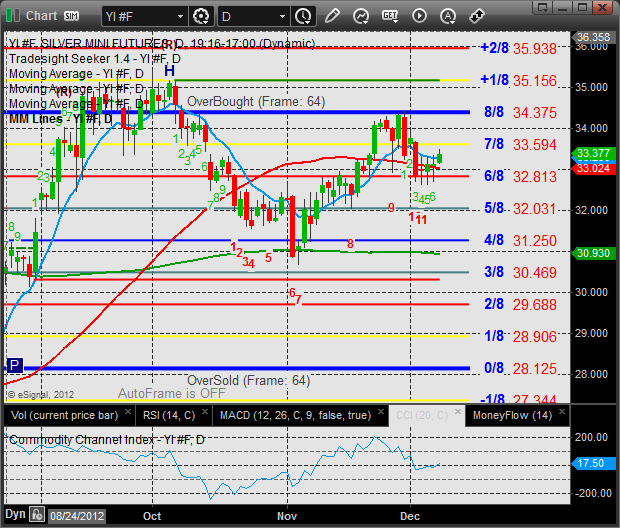
Silver:

The NQ futures put in a similar relative performance to the SP but still have a very different technical setup as price remains below the 50 and 200dma’s. The Relative weakness in the NQ side will be discussed in more detail below. Keep a close eye on the key 4/8 Gann level just abovfe.

Multi sector daily chart:

Total put/call ratio:

The 10-day Trin remains neutral:

The NDX has had persistent weakness vs. the SPX side since mid-September. This is a clear warning sign and a classic intermarket divergence. This condition needs to be rectified or it will surely hold back the overall broad market. Note the attempt to break back into the trend channel and rejection.

While the NDX tends to lead the SPX within the NDX there is a key leading component the SOX. As described above the NDX has relative weakness but the SOX has been improving after not making a new relative low. If the SOX can get back above the trend channel, then the NDX will have its trend leading component in a bullish position of relative strength.

The BTK was the top Naz sector, once again challenging the active static trend line.

The XAU is bouncing off a short-term oversold condition.

The SOX has settled above the static trend line and is now on the north side of the 10ema and 50dma. The next challenge will be the 200dma if it can clear relatively minor 5/8 Murrey math level.

The OSX is still grinding in the area of the active DTL:

The BKX was a laggard and is still contained by the 50dma:

If oil moves just a bit lower it will record a Seeker exhaustion buy:

Gold:

Silver:

