- The island reversals came first
- The beginning of last week created another void on the daily and weekly charts
- Will the shorts get burned?
Last Friday, the price of nearby natural gas settled at just below the $2.30 per MMBtu level as the bear market in the energy commodity continued to grip the futures market. Last year during the second week of December, the price of January futures was trading at had traded between $3.787 and $4.666 per MMBtu. The price is currently less than half the level at the high at the same time in 2018 because inventories in storage are over 20% higher. There is more than enough natural gas available to meet all requirements during the peak season of demand through March.
Natural gas has handed out lots of pain to those holding long positions in the hope that a rebound during the beginning of the 2019/2020 winter season would develop. The shorts are in control of the market, and many are looking for the price to drop below $2 and challenge the March 2016 low at $1.611 per MMBtu in early 2020.
The island reversals came first
The island reversal from early November turned out to be a highly bearish formation for the natural gas market at the start of the winter of 2019/2020.
The weekly chart highlights the void between $2.738 and $2.753. A much wider gap between $3.368 and $3.516 developed between the weeks of November 5 and December 17 in 2018, but the price action filled the void during the week of December 24.
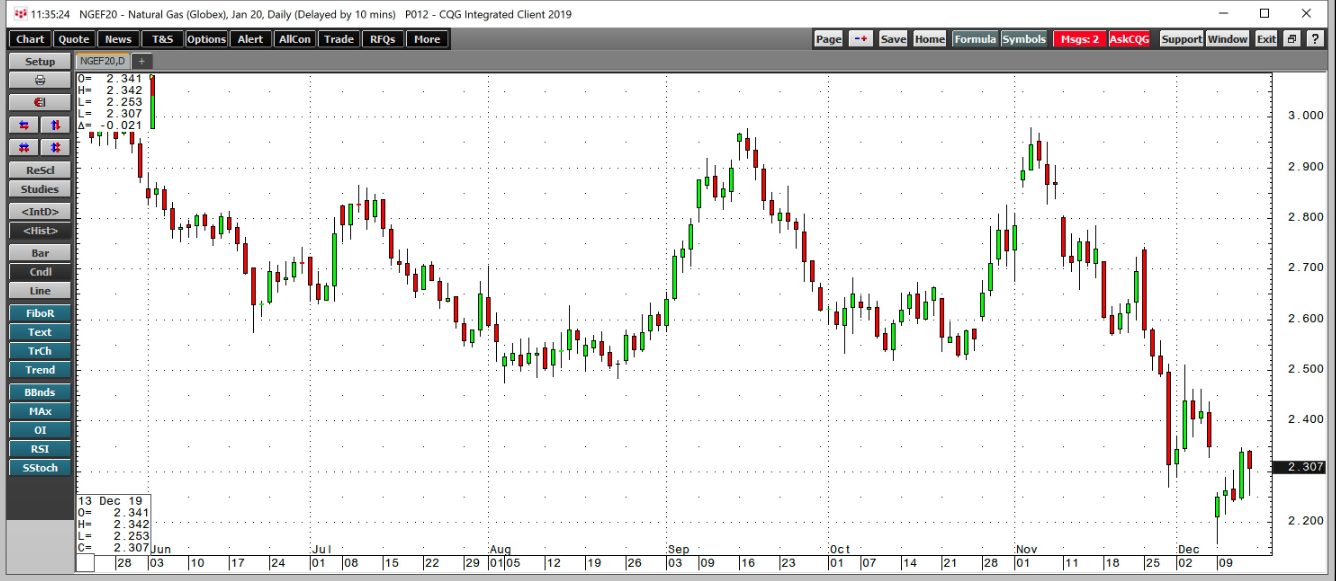
Meanwhile, the gap in the active month January futures contract is from $2.826 to $2.829 per MMBtu. Filling that hole in the chart would require a significant price recovery as the price was around the $2.30 level at the end of last week.
The beginning of last week created another void on the daily and weekly charts.
At the start of last week, aggressive selling when the market opened on Sunday night caused another gap to develop on the short-term daily natural gas chart.

(Source: CQG)
The price of natural gas fell to a low at $2.328 on Friday, December 6. The low at the end of November was $2.27. On Monday, December 9, the January futures traded to a high at $2.258 per MMBtu and created another void on the chart. However, the price action during the week erased the latest gap as the price traded up to a high of $2.348 on December 12. Since the void came over the weekend, it creates another gap on the weekly chart that disappeared by last Thursday.
Will Shorts Get Burned?
Since early November, anyone with a long position in the natural gas futures market or related ETF products has suffered as the shorts have been in control. Natural gas is one of the most volatile commodities that trade on the futures market as price explosions and implosions tend to be the norm rather than the exception.
Natural gas futures often hand out the most considerable pain when the market’s overall position leans in one direction or the other. In October and November 2018, a significant position where many market participants were long crude oil and short natural gas futures lit a bullish fuse that carried the price to its highest level since 2014 at $4.929 per MMBtu.
The recent price action has been highly bearish, which has rewarded those holding short speculative positions. With plenty of winter left ahead, and a price gap considerably above the current price level, the trend is lower and shorts continue to push the price to the downside. It could be only a matter of time until the pain pendulum shifts from the bulls to the bears, as filling the gap on the upside could cause the shorts to scramble out of risk positions.
The United States Natural Gas Fund L.P. (UNG) was trading at $18.13 per share on Monday afternoon, up $0.45 (+2.55%). Year-to-date, UNG has declined -22.26%, versus a 20.43% rise in the benchmark S&P 500 index during the same period.
UNG currently has an ETF Daily News SMART Grade of C (Neutral), and is ranked #51 of 109 ETFs in the Commodity ETFs category.
