In natural gas, there’s more than one way to ascertain how prices are likely to shape this winter. The cold, of course, is one gauge. The other: the so-called widow-maker spread between Henry Hub’s March and April contracts that traders bet on, based on weather forecasts.
In the world of markets, a widow-maker is an investment that results in large, potentially, devastating losses—metaphorically fatal so they create widows. The March-April widow-maker has claimed countless scalps in natural gas, most famously that of Brian Hunter, the trader who sank his Amaranth hedge fund in 2017 with an $8 billion loss after going the wrong way, partially on that bet.
At Wednesday’s settlement, Henry Hub’s widow-maker spread turned negative for the first time since colder temperatures officially began with the fall season on Sept. 22.

While the March contract settled at just slightly more than a half cent discount to April, the failure of the last official month of winter to hold a premium to its next successive month was a signal that it might not be a favorable winter for gas bulls.
“Various Warning Signs Are Flashing”
Dan Myers, analyst at Houston-based gas risk consultancy Gelber & Associates, referred to the widow-maker in a Wednesday email to the firm’s clients, and how it could impact positioning for the winter:
“Various warning signs are flashing across the board and the outlook for near-month gas prices has not appreciably improved.”
“Additionally, the ‘widowmaker’ spread between March and April futures has flipped negative for the first time and suggests that traders have little hope for the current winter.”
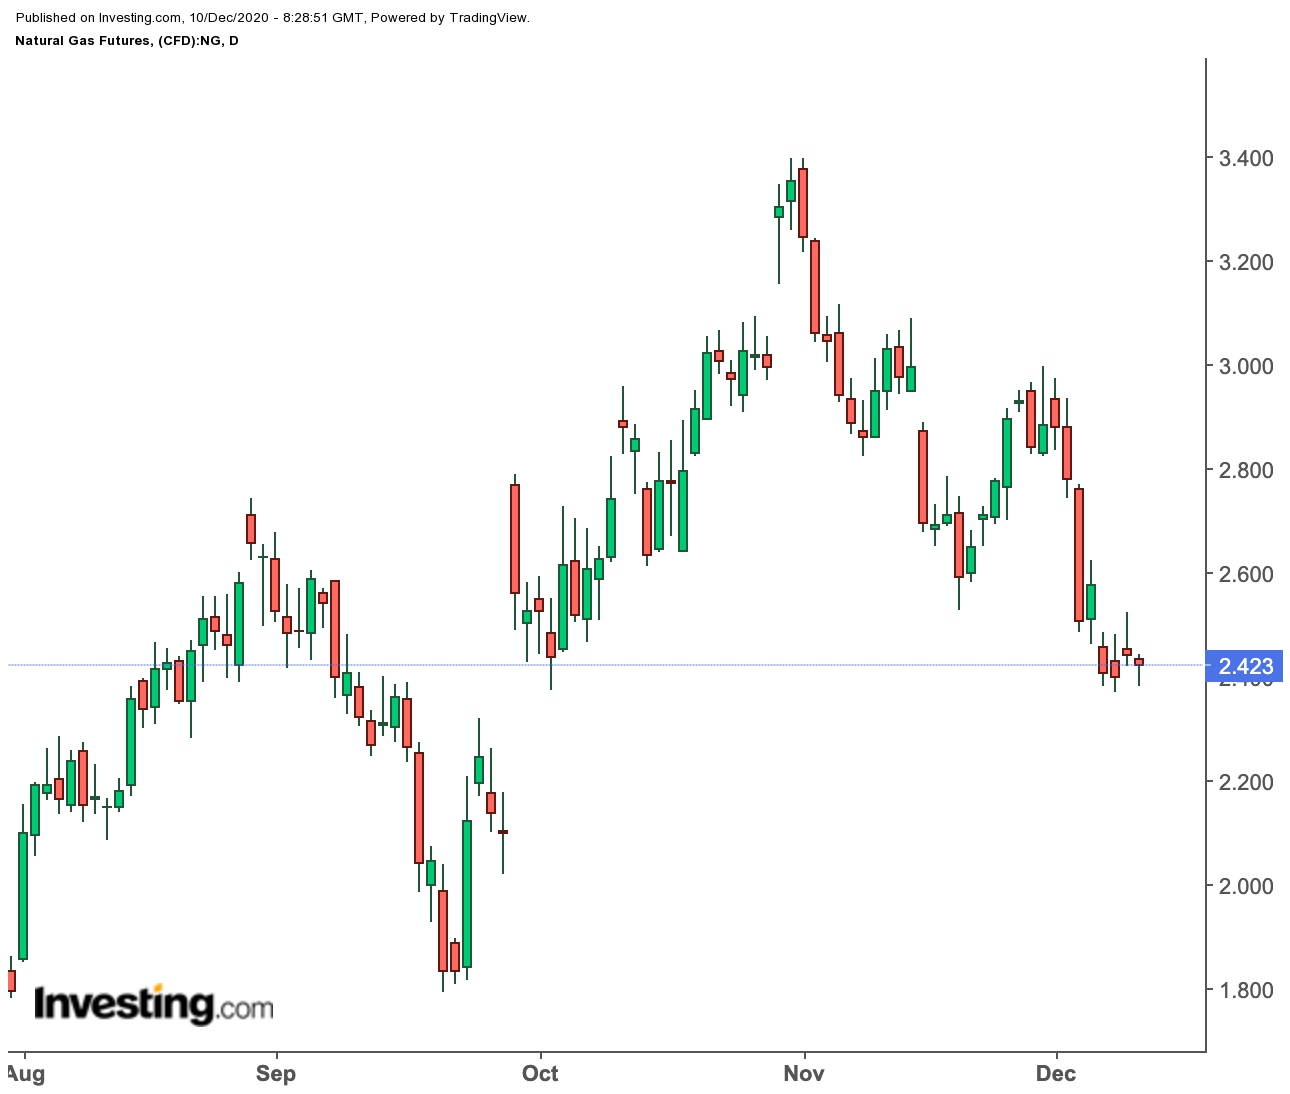
Myers’ note came after Henry Hub’s front-month contract for January hit a 10-week low of $2.368 per million metric British thermal units, or mmBtu, in Tuesday’s trade. On Wednesday, January gas fell almost 1.8%, bringing its current weekly loss to 7%, on top of the previous week’s 9% drop.
On the gas storage front, the US Energy Information Administration’s report for the week ended Dec. 4 is likely to show a sharp drawdown of 83 billion cubic feet, triggered by a cold snap, a consensus of analysts showed. That compares with the previous week’s paltry draw of just 1 bcf caused by unseasonably warm weather.
Cold In, Blowtorch Warmth Out
Some market participants, like Scott Shelton, energy futures broker at ICAP in Durham, North Carolina, remain optimistic that the weather will remain cold in the near-term. In a note to his clients on Wednesday, Shelton said:
“Longer term models are showing more variability to the pattern at the end of the 11-15 day rather than blowtorch warm like it did previously. I have noticed that power burns have improved over the last week with the 5-day change up 1.4 bcf a day after being up as much as 2.5 bcf/day earlier in the week.”
“This could be a sign of the supply & demand improvement that the market needs to hold these levels as it’s a ‘real sign’ of the tightness that most people are adding to their end of season expectations already due to lower prices. It will be interesting to see if that continues.”
So, what exactly do the weather models say?
Bespoke Weather Services, in projection carried by naturalgasintel.com, said it doesn’t see “anything more than a couple of days here and there” that can get close to normal demand, nationally.
It added, however:
“The negative North Atlantic Oscillation is “interesting,” in that any weakening of the position Eastern Pacific Oscillation would definitely increase the risk of a materially colder shift.”
“That is not something we see on the horizon yet, but…we will be watching for any shifts in the orientation of tropical forcing that could change that narrative late in the month. It is difficult to project in which direction the next 10-cent move will be in.”
Back to gas pricing, Investing.com’s Daily Technical Outlook is maintaining its “Strong Sell” call on Henry Hub’s front-month January contract, with a three-tier Fibonnaci support, first at $2.423, then at $2.398 and $2.359.
Should the front-month buck the trend and turn bullish again, then Fibonacci resistance will likely be from $2.501 through $2.526 and $2.565.
As with all projections, we urge you to follow the calls but temper them with fundamentals—and moderation—whenever possible.
Disclaimer: Barani Krishnan uses a range of views outside his own to bring diversity to his analysis of any market. He does not own or hold a position in the commodities or securities he writes about.
