In the last couple of months, the sharp reversion in oil prices has certainly caught the world’s attention. While the majority of economists and analysts continue to expect incorrectly that falling oil prices are a positive input to economic growth, the reality is that it is not. The negative impact to economic growth from the decline in oil prices are quite considerable when you consider that almost 40% of all the jobs created since 2009 have been in energy related industries.
Furthermore, many of those jobs are in the highest wage paying areas of the country that leads to more consumption and further job growth in other areas of the economy. In fact, for each job created in the energy sector there are nearly three jobs created elsewhere in the economy.
“What we have here is a failure to communicate.” - Cool Hand Luke, 1967
As I discussed at length previously, the current problem in the energy price is a realization of a supply / demand imbalance.
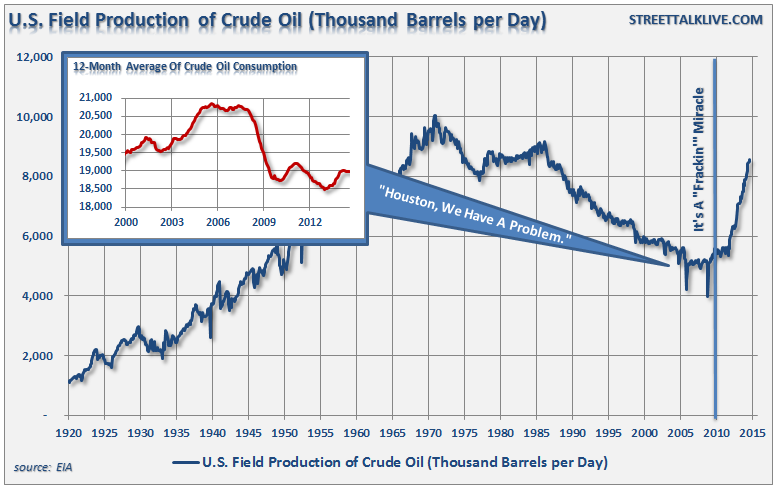
"First, the development of the‘shale oil’ production over the last five years has caused oil inventories to surge at a time when demand for petroleum products is on the decline as shown below."
"The obvious ramification is a ‘supply glut’which leads to a collapse in oil prices. The collapse in prices leads to production‘shut-ins,’loss of revenue, employee reductions, and many other negative economic consequences for a city dependent on the production of oil.”
Once you factor in the negative economic consequences of the decline in oil prices, any perceived positive impact from lower gasoline prices, by the consumer, will be quickly negated. (Read more here)
However, if you don’t believe me, here is T. Boone Pickens:
$33 Oil – A Return To Normalcy
While the economists and analysts are hopeful for a sharp recovery in oil prices, the current decline in oil prices is nothing more than a return to historical normalcy. Let me explain.
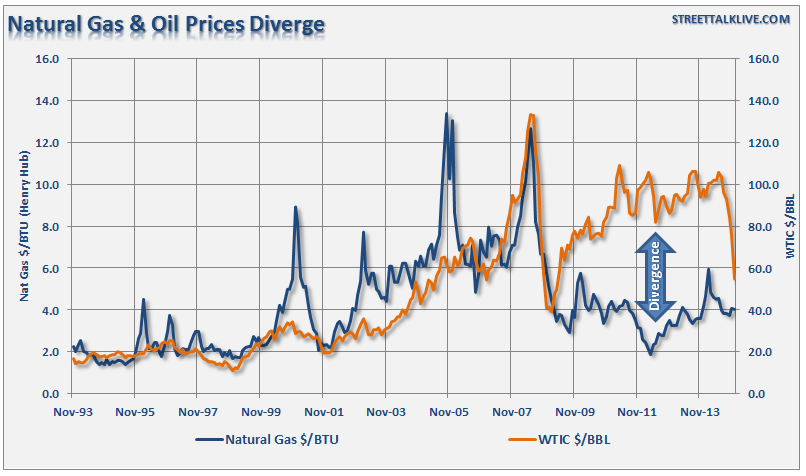
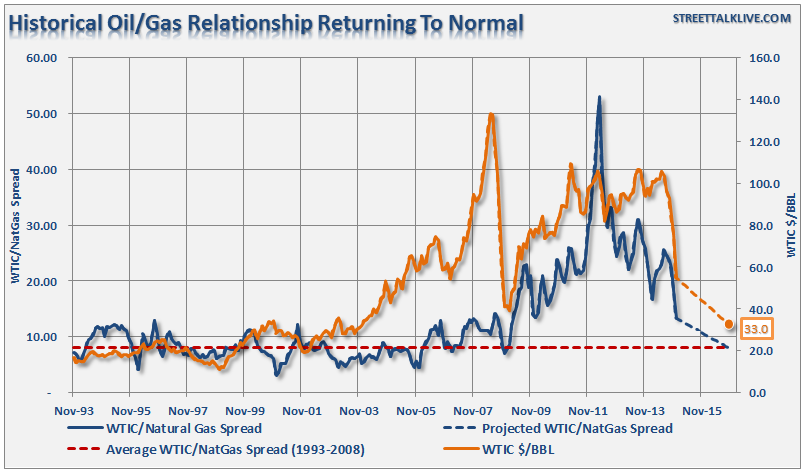
If you ask virtually any oil and gas professional, that has been around the industry longer than the graduating class of 2000, they will tell you that the historical relationship between oil and gas prices is roughly $8. The chart below shows the highly correlated history of oil and gas prices until 2008.
Not surprisingly, the divergence between oil and gas prices came to fruition in conjunction with the massive interventions by the Federal Reserve, which lowered borrowing costs enough to sufficiently provide for funding of higher cost shale exploration. As Yves Smith recently stated:
“The oil and gas sector is capital intensive. Drillers have borrowed phenomenal amounts of money, which was nearly free and grew on trees, to acquire leases and drill wells and install processing equipment and infrastructure. Even as debt was piling up,the terrific decline rates of fracked wells forced drillers to drill new wells just keep up with dropping production from old wells, and drill even more wells to show some kind of growth. One heck of a treadmill. Funded in part by junk debt.
Junk bond issuance has been soaring as the Fed repressed interest rates and caused yield-hungry investors to close their eyes and take on risks, any risks, just to get a teeny-weeny bit of extra yield. Demand for junk debt soared and pushed down yields further. And even within this rip-roaring market for junk bonds, according to Bloomberg, the proportion issued by oil and gas companies jumped from 9.7% at the end of 2007 to 15% now, an all-time record.”
With an excess supply now realized, particularly as global demand continues to wane, oil prices are now returning back towards their historical long-term relationship.
If we assume that natural gas, which has been trading around $4 per BTU, has already returned a more normalized supply/demand range this would imply that oil prices have further to fall. The chart below is an extrapolation of the current West Texas Intermediate Crude price forecasted into 2016 on a monthly basis. It would currently require a decline in oil prices to $33 per barrel to return the WTIC/NatGas ratio back to its historic spread of $8.
As T. Boone Pickens notes in his interview, the main supply / demand divergence is in the process of returning back towards equilibrium particularly in light of the deflationary forces that exist on the global landscape. While it is certainly feasible that we could see a sharp “snap back” rally from the recent plunge in oil prices, it is likely an opportunity to reduce energy exposure in portfolios before the next leg lower.
Just as a reminder, the last time oil prices fell 50% from their peak was in 1985-86. Oil prices then stayed at those levels until the turn of the century. The rebalancing of supply and demand could leave oil prices at lower levels for much longer than the majority of analysts currently believe. Considering that oil production related states have done the majority of the work related to the current domestic economic recovery, such an outcome could derail the hopes for a continued economic revival.


