To weather watchers in the gas trade, the past week or two must have felt like something right out of the 1970s rock classic “One-Way Wind”, where Arnold Muhren of Dutch band, Cats asks bewilderedly: “Why you blow the cold every day ... Tell me what are you trying to say?”
For some, there hasn’t been much sense in the sudden turn in US Northeasterly winds over the past couple of weeks which have brought unexpected chill to the region, versus earlier forecasts of warmth.

Bespoke Weather Services said in a post on the naturalgasintel.com portal on Wednesday that cooler trends had grown more entrenched over the previous 24 hours, with both the American and European forecast models adding 10-12 GWDD, or gas-weighted degree days, over the next two weeks.
The bullish shift developed “thanks to more chill in the Midwest and East…It remains difficult for weather to move the needle much at this time of year, but double-digit GWDD changes in a 24-hour period are noteworthy,” Bespoke said. “This generally equates to a lot of 50s highs/30s lows in places like the Midwest,” driving heating demand.
It is against this backdrop that another weekly update on US natural gas storage is due from the Energy Information Administration at 10:30 AM ET (14:30 GMT) today.
A consensus of estimates from industry analysts tracked by Investing.com shows the EIA is likely to report an addition of 67 bcf, or billion cubic feet, to storage for the week ended Apr. 9.
That would be in line with the 68 bcf injection seen during the same week a year ago, although it will also be more than 2-/2 times the five-year (2016-2020) average injection of 26 bcf.
It would also be 47 bcf above the 20 bcf injection into storage for the week ended Apr. 2.
Typically, a higher injection into storage indicates that more than adequate gas was produced that week versus utilities’ needs. After burning whatever is required for heating and power generation, utilities will pump the balance into salt caverns and other underground storage facilities.
Odd Situation: Cooler Winds But Fewer HDDs
What’s odd about the forecast for the 67-bcf build for last week though is that the official number of HDDs, or heating degree days, during the week were lower despite the colder winds in the Northeast, the largest gas-driven heating market in the United States.
HDDs measure the number of degrees that a day's average temperature is below 65 degrees Fahrenheit (18 degrees Celsius) and are used to estimate demand for heating homes and businesses.
According to data provider Refinitiv, there were 43 HDDs last week, compared with the 30-year norm of 90 HDDs.
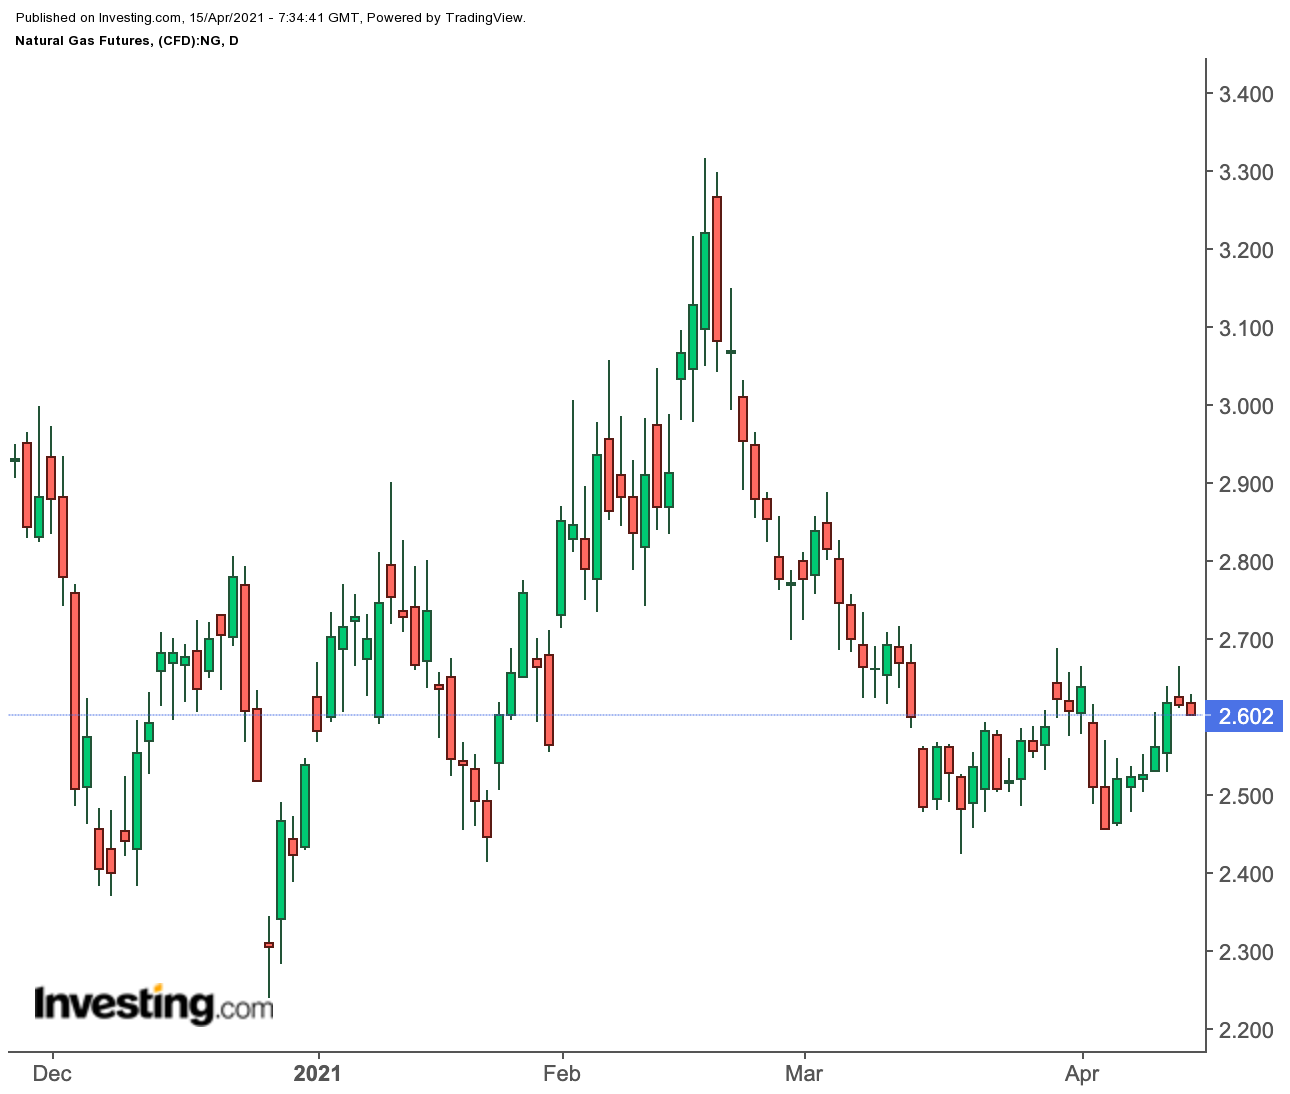
Thus, this week’s near 4% rally in gas futures on the New York Mercantile Exchange’s Henry Hub may not be defensible if the storage number were to come in any higher, said some market watchers.
Average 5-Year Gas Stockpiles Seen Up 1%
Gelber & Associates, a Houston-based gas markets consultancy, said in a note issued to its clients and shared with Investing.com on Wednesday:
“As colder-than-normal temperatures continue to make an appearance towards the latter half of the two week weather forecast, additional expectations of weather-driven demand are allowing for the upward momentum to continue.”
“If the injection into natural gas storage is larger than market expectations, it should put parrying pressure on prices.”
If analysts are on track with their 67-bcf estimate for last week, total stockpiles of gas in storage would rise to 1.851 tcf, or trillion cubic feet—almost 1% over the five-year average and 11.3% lower than the same week a year ago.
If correct, this would push storage over the five-year average for the first time since the February freeze in Texas and the Central US that resulted in a massive spike in heating needs and sharp deficit in gas stockpiles.
On the LNG front, the turn in spring weather combined with higher exports of liquefied natural gas to Mexico “has been enough to promote a much better supply/demand balance the last few weeks,” Bespoke Weather Services said.
LNG feed gas levels exceeded 11 bcf on Wednesday, data showed. Volumes have held near or above that threshold for a month, bolstered by ongoing demand for US exports from both Asia and Europe.
EBW Analytics Group said demand for natural gas this week has also been aided by a steep decline in wind output in Texas. “This required heavy utilization of gas-fired generating units,” the firm said.
Technicals Show Natural Gas A 'Strong Buy'
Technical charts of natural gas, however, suggest more upside in the near term.
Should the market extend its bullish trend, a three-tier Fibonacci resistance is forecast, first at $2.653, then $2.666 and later at $2.688.
In the event of a turnaround, then a three-stage Fibonacci support is expected to form, first at $2.609, then $2.596 and later at $2.574.
In any case, the pivot point between the two is $2.631.
As with all technical projections, we urge you to follow the calls but temper them with fundamentals—and moderation—whenever possible.
Disclaimer: Barani Krishnan uses a range of views outside his own to bring diversity to his analysis of any market. For neutrality, he sometimes presents contrarian views and market variables. He does not hold a position in the commodities and securities he writes about.
