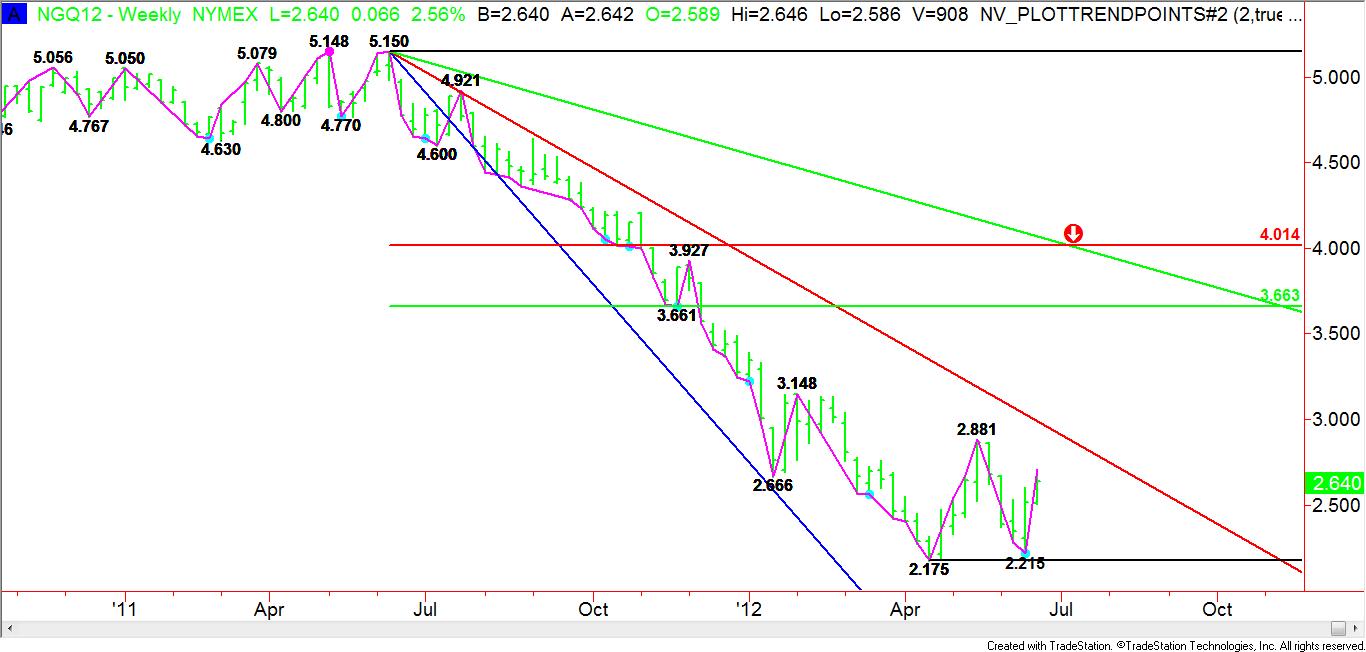
The weekly August Natural Gas futures chart indicates that the market is moving closer to turning the main trend to up. This is something that natural gas hasn’t experienced since last summer.
The weekly swing chart indicates that a trade through 2.881 will turn the main trend to up. This move will also confirm the double-bottom at 2.175 and 2.218. Based on the main range of 5.150 to 2.175, a 50% retracement will mean a test of 3.663. It sounds like a long-shot at this time, but a 61.8 or Fibonacci retracement, could take the market to 4.014.

Even if this swing top is broken, traders still have to deal with an important downtrending Gann angle at 2.990 this week. However, once this angle is pierced the market should have a clean shot at reaching the 50% level.
One potential upside target is the resistance cluster at 4.01 to 4.014 the week-ending July 13. This target appears to be a long way off, however, if shorts cover en masse, a test of this price and time target is possible. Strong upside momentum combined with rising volume will be needed to drive natural gas higher.
Based on a confirmation of the double-bottom chart pattern, a breakout over 2.881 could reach an objective of 3.587. This move may also take about 4-weeks to develop.
Fundamentally, an increase in demand because of air conditioning use in natural gas areas could be the catalyst behind the move. Bullish traders are banking on hot weather to drive up demand from the electrical power producers. News that the number of active rigs for natural gas is at its lowest level since September 1999 is another bullish factor. Finally, traders should pay attention to any drawdowns in inventory.
Overall, the chart pattern suggests that there is tremendous upside potential in natural gas, but it is going to take some hot weather to drive it sharply higher over the near-term.
The weekly swing chart indicates that a trade through 2.881 will turn the main trend to up. This move will also confirm the double-bottom at 2.175 and 2.218. Based on the main range of 5.150 to 2.175, a 50% retracement will mean a test of 3.663. It sounds like a long-shot at this time, but a 61.8 or Fibonacci retracement, could take the market to 4.014.

Even if this swing top is broken, traders still have to deal with an important downtrending Gann angle at 2.990 this week. However, once this angle is pierced the market should have a clean shot at reaching the 50% level.
One potential upside target is the resistance cluster at 4.01 to 4.014 the week-ending July 13. This target appears to be a long way off, however, if shorts cover en masse, a test of this price and time target is possible. Strong upside momentum combined with rising volume will be needed to drive natural gas higher.
Based on a confirmation of the double-bottom chart pattern, a breakout over 2.881 could reach an objective of 3.587. This move may also take about 4-weeks to develop.
Fundamentally, an increase in demand because of air conditioning use in natural gas areas could be the catalyst behind the move. Bullish traders are banking on hot weather to drive up demand from the electrical power producers. News that the number of active rigs for natural gas is at its lowest level since September 1999 is another bullish factor. Finally, traders should pay attention to any drawdowns in inventory.
Overall, the chart pattern suggests that there is tremendous upside potential in natural gas, but it is going to take some hot weather to drive it sharply higher over the near-term.
