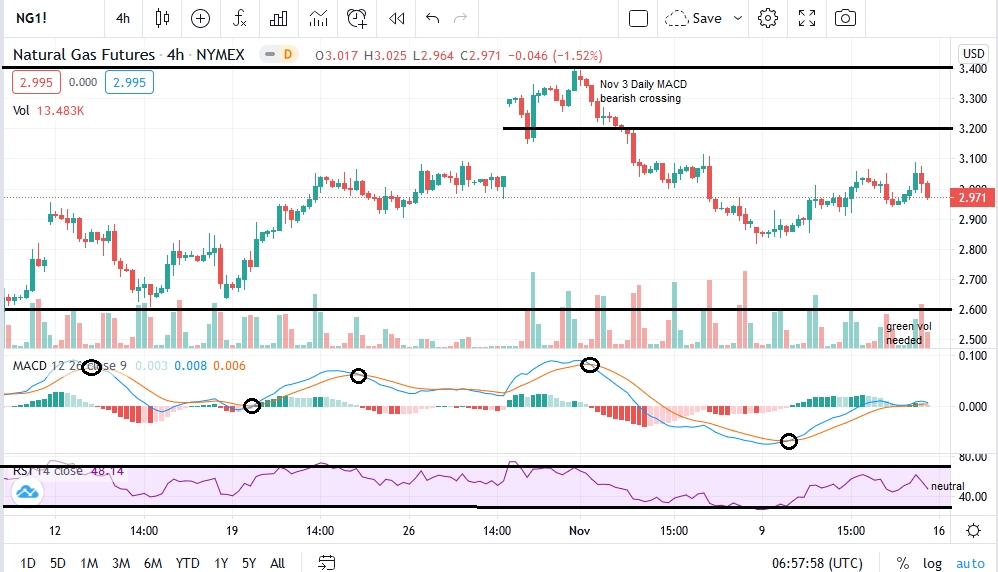
Natural Gas futures on the NYMEX had a volatile week before closing 0.34% lower than a week ago at $2.88. The January contract lost some ground closing at $3.21. May contract is currently trading at $2.77. EIA confirmed on Friday a build of 8 Bcf for the week ended November 6. Current inventory at 3,927, still 5.3% higher y/y, 4.7% above the 5-year average and above the 5-year maximum.
Selling rallies is what we want to do from now on, trading the near term charts directionally. Price is ranging near a potential seasonal ceiling while the last two contacts had already been losing momentum following the seasonal uptrend which for different reasons came earlier this season. We have no interest in buying Natural Gas at the moment. Opportunities are to be found on exhaustion around $3.30. We have no interest whatsoever following buying legs while we operate lower than $3.50. We already took more than 50% in real time trading on the uptrend after we have identified a floor at $1.50 in May. We do now want to be too greedy about this idea. Any production concerns have already been absorbed fuelling this seasonal uptrend further. U.S. online Natural Gas rigs remain low but this is not something new. Vaccine-fueled rallies are to be seen across the board lately, so chances for a wide spread hedging, on short term use of the market for end-of-year trading are low.
Commercial, industrial and residential demand will be key for the coming weeks and will give us a better benchmark for the spring contracts. The withdrawal levels will offer better visibility as well. Total demand for the coming week remains between moderate and low. New stay-at home restrictions are being put in place for a second time because of record levels of infections and hospitalizations across the Lower 48. The economic recovery is temporarily losing momentum. U.S. macro data and the dollar Index to be routinely monitored. Daily, 4hour, 15min MACD and RSI pointing entry areas. 
- English (UK)
- English (India)
- English (Canada)
- English (Australia)
- English (South Africa)
- English (Philippines)
- English (Nigeria)
- Deutsch
- Español (España)
- Español (México)
- Français
- Italiano
- Nederlands
- Português (Portugal)
- Polski
- Português (Brasil)
- Русский
- Türkçe
- العربية
- Ελληνικά
- Svenska
- Suomi
- עברית
- 日本語
- 한국어
- 简体中文
- 繁體中文
- Bahasa Indonesia
- Bahasa Melayu
- ไทย
- Tiếng Việt
- हिंदी
Natural Gas Sees Vaccine-Fueled Rallies. Here's What To Do
Published 11/15/2020, 03:43 AM
Updated 07/09/2023, 06:32 AM
Natural Gas Sees Vaccine-Fueled Rallies. Here's What To Do
Latest comments
Loading next article…
Install Our App
Risk Disclosure: Trading in financial instruments and/or cryptocurrencies involves high risks including the risk of losing some, or all, of your investment amount, and may not be suitable for all investors. Prices of cryptocurrencies are extremely volatile and may be affected by external factors such as financial, regulatory or political events. Trading on margin increases the financial risks.
Before deciding to trade in financial instrument or cryptocurrencies you should be fully informed of the risks and costs associated with trading the financial markets, carefully consider your investment objectives, level of experience, and risk appetite, and seek professional advice where needed.
Fusion Media would like to remind you that the data contained in this website is not necessarily real-time nor accurate. The data and prices on the website are not necessarily provided by any market or exchange, but may be provided by market makers, and so prices may not be accurate and may differ from the actual price at any given market, meaning prices are indicative and not appropriate for trading purposes. Fusion Media and any provider of the data contained in this website will not accept liability for any loss or damage as a result of your trading, or your reliance on the information contained within this website.
It is prohibited to use, store, reproduce, display, modify, transmit or distribute the data contained in this website without the explicit prior written permission of Fusion Media and/or the data provider. All intellectual property rights are reserved by the providers and/or the exchange providing the data contained in this website.
Fusion Media may be compensated by the advertisers that appear on the website, based on your interaction with the advertisements or advertisers.
© 2007-2025 - Fusion Media Limited. All Rights Reserved.
