In articles over the past weeks, I suggested that the upward trajectory of the Natural Gas Futures market started a bit too early. Last week, the price of the energy commodity declined and moved below its pivot point at $2.50 per MMBtu as the October futures contract on NYMEX rolled to November.
The most liquid natural gas ETF product that reflects the price movement in the natural gas futures arena is the United States Natural Gas Fund (UNG). With the injection season ending in less than two months, the selloff in the natural gas market could be an opportunity for market participants. The uncertainty of the weather conditions over the coming winter season is likely to support at least one significant rally in the energy commodity. The United States is now the world’s dominant force in natural gas. Record production and LNG exports to the world as a result of technological advances and regulatory reforms have increased the supply and demand side of the natural gas market. The energy commodity has a long history as one of the most volatile futures markets. We could see lots of action in natural gas over the coming weeks and months.
The first attempt at a rally came to early
The active month October NYMEX natural gas futures contract rolled to November last week, which is the first month of the 2019/2020 season where inventories decline.

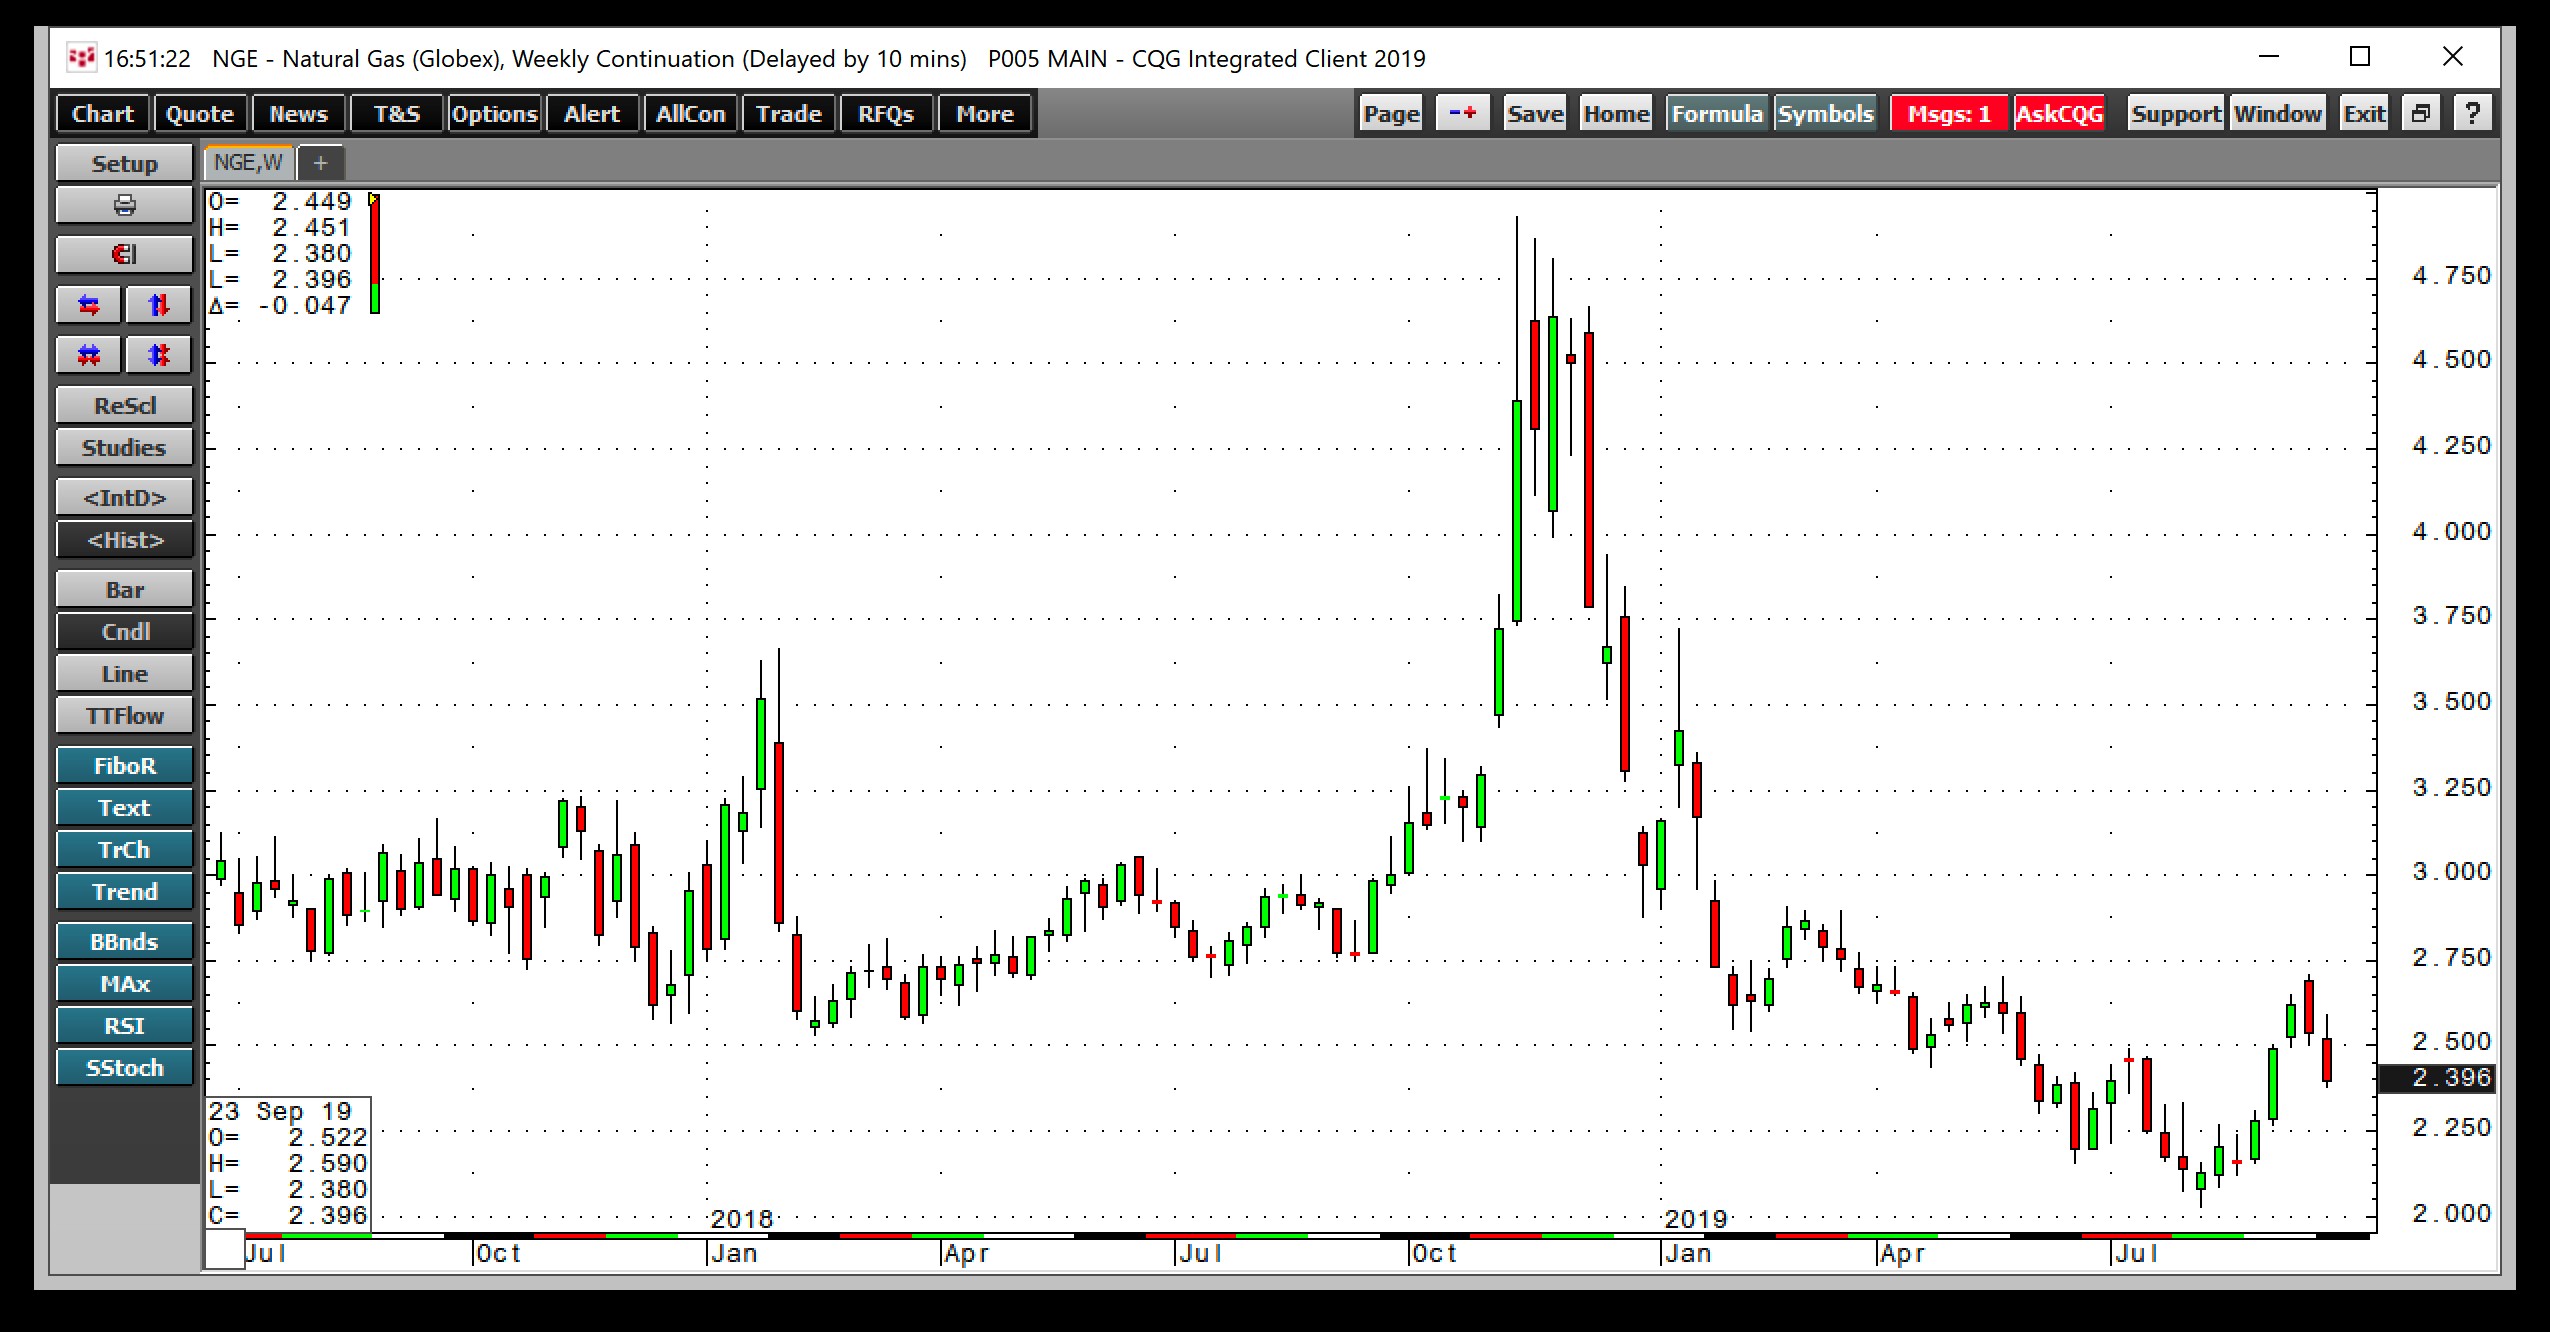
The weekly chart highlights that the price rose from a low at $2.029 per MMBtu in early August to a high at $2.71 during the week of September 16 when it ran into selling. The move of 33.6% gave way pushed the price over technical resistance at the $2.50 level. In 2017 and 2018 natural gas found lows at just over the $2.50 per MMBtu which is now a pivot point for the energy commodity.
A triple-digit injection sends the price lower
The consensus estimate for the injection into natural gas inventories around the US was for stocks to rise by 85-90 billion cubic feet for the week ending on September 20. On Thursday, September 26, the Energy Information Administration reported that stockpiles rose by 102 bcf, which encouraged selling to accelerate in the futures market. At the end of last week, the price fell to a low at $2.38 and settled at $2.404 per MMBtu on the nearby November futures contract.
With around seven weeks to go in the injection season, the amount of natural gas in storage will rise above last year’s high at the start of the peak season at 3.247 trillion cubic feet. As of last week, stockpiles stood at 3.205 tcf. However, reaching the four tcf level, which was the high from 2015 and 2016, is not likely. Inventories were 16.1% above last year’s level but still stand at 1.4% below the five-year average. A rise in stocks that pushes them above the five-year average could encourage more selling. However, market participants are likely to be cautious as Mother Nature controls the weather conditions over the winter season, which will determine the path of least resistance for the price of natural gas.
Open interest has dropped sharply
Open interest is the metric that reflects the total number of open long and short positions in a futures market.

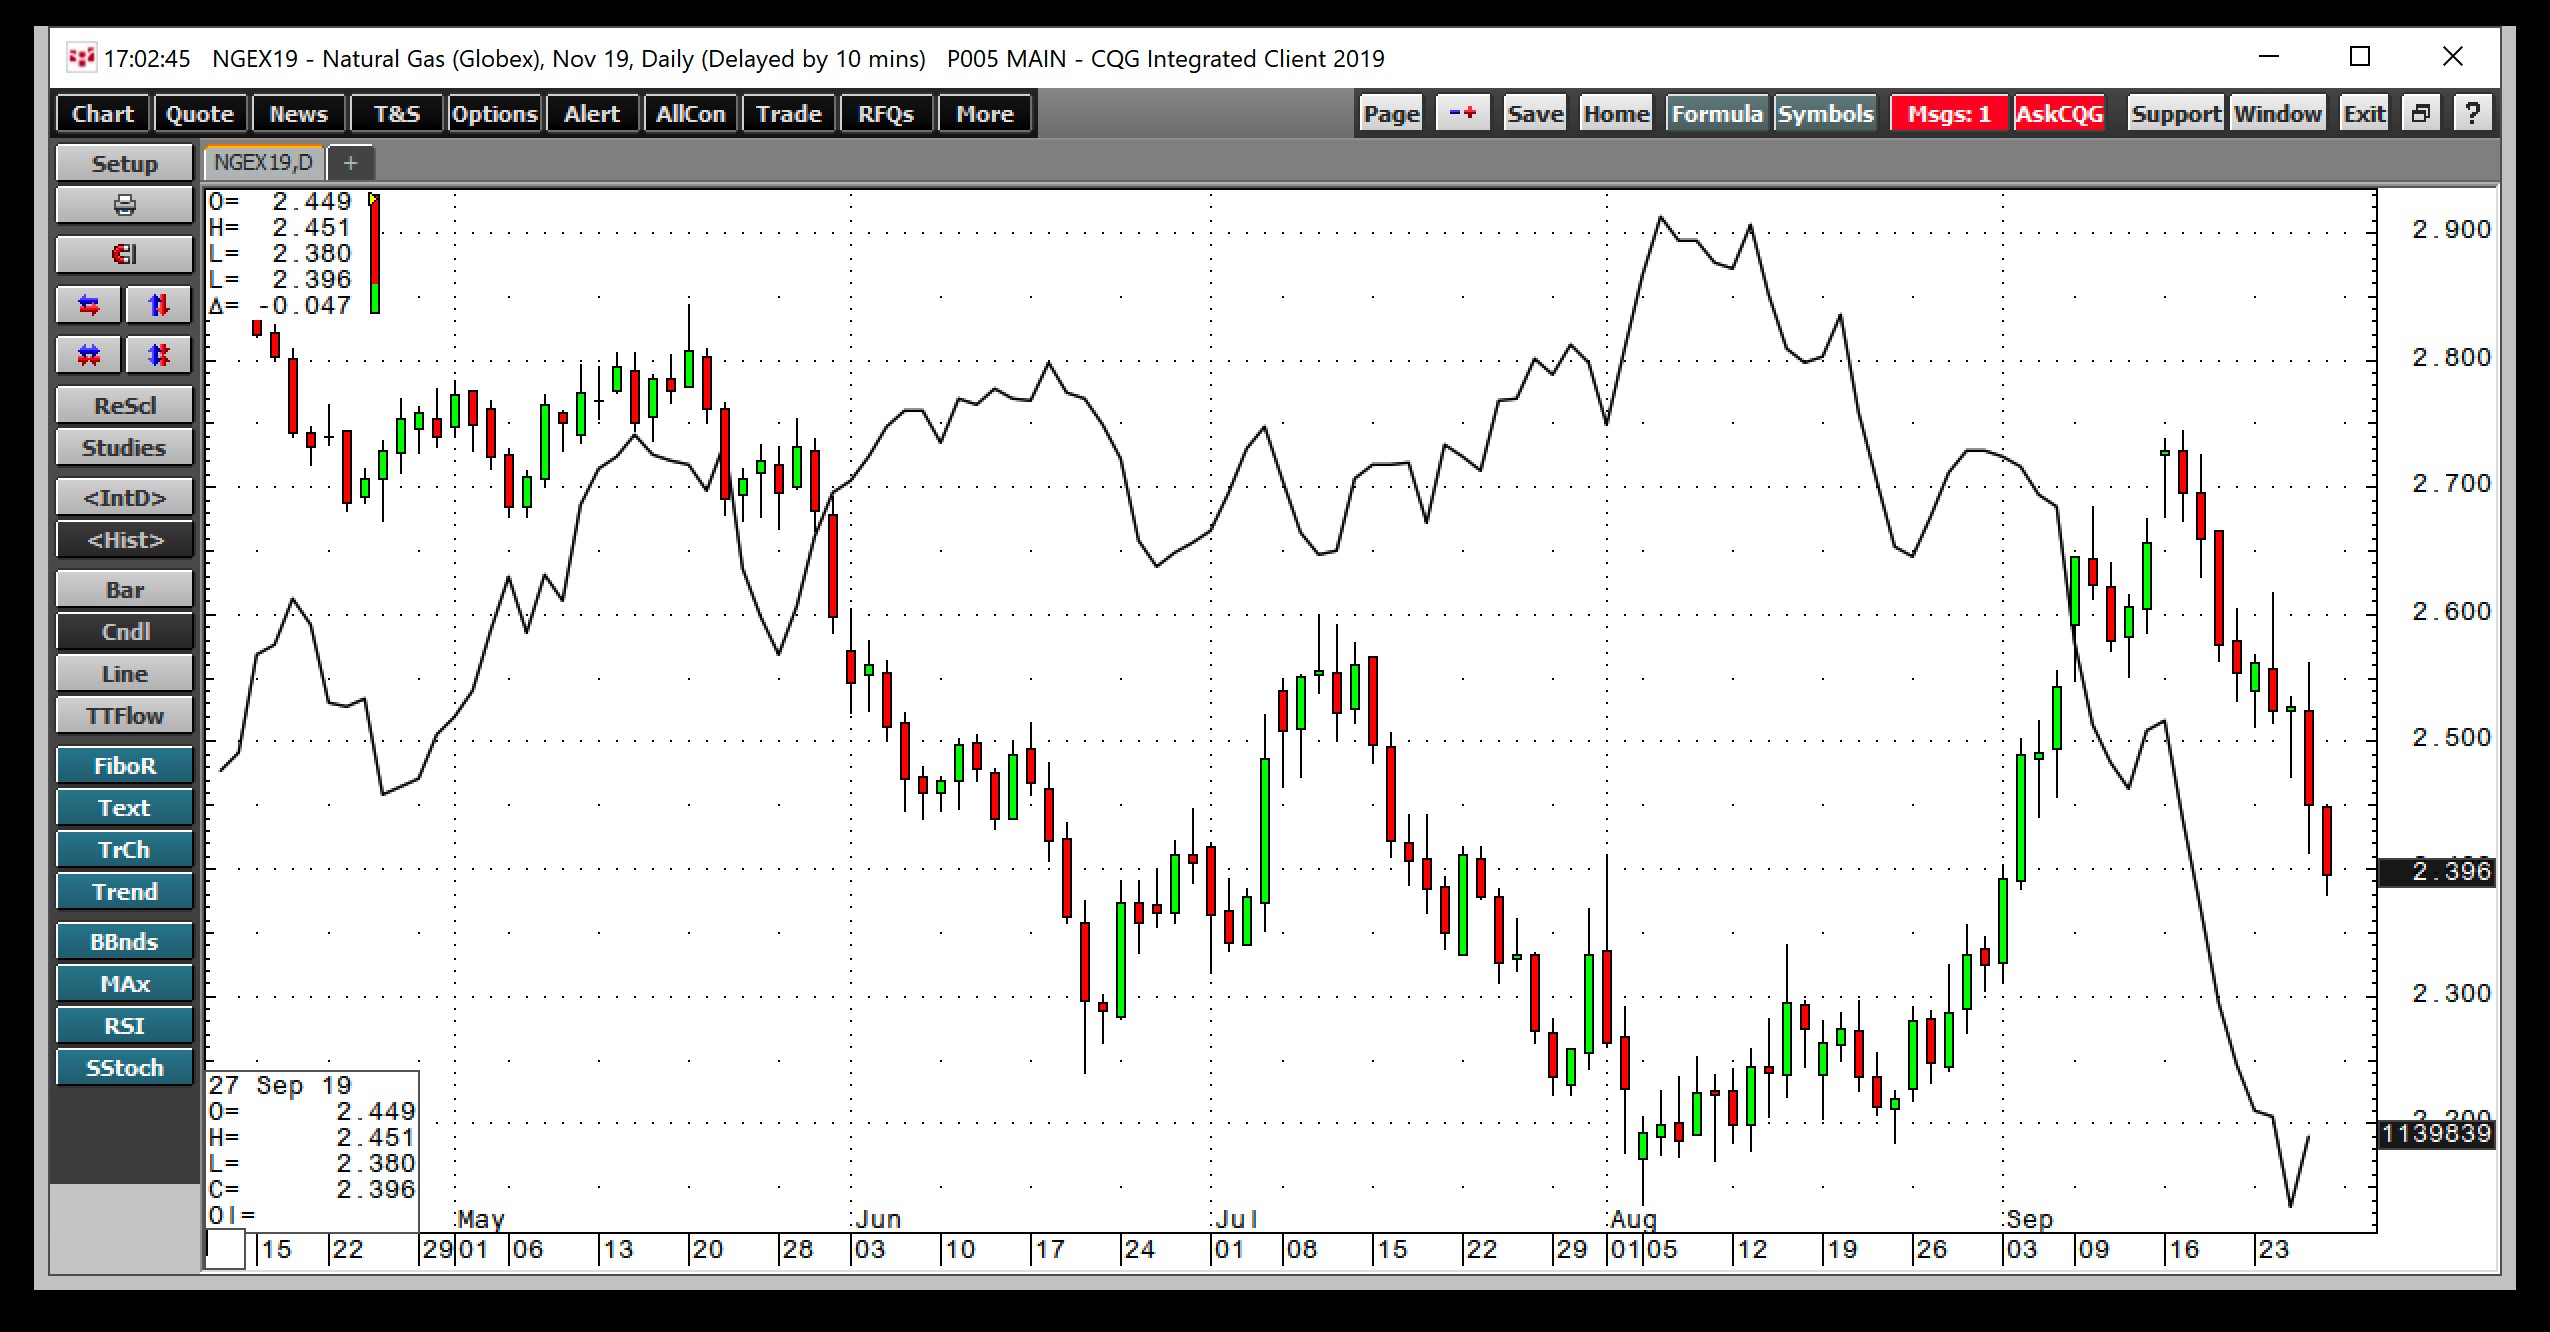
As the chart illustrates, the metric fell from a high at 1.375 million contracts on August 6 when natural gas was near the lowest level since 2016 at $2.029 per MMBtu. The metric declined steadily as the price of the energy commodity recovered to $2.71 and fell once again to under the $2.40 per MMBtu level last week. At 1.140 level at the end of last week, open interest was over 17% below the early August peak. Declining open interest is not a technical validation of a developing trend in a futures market.
The recent selling in the natural gas market could be an opportunity to buy. The market will soon realize that the uncertainty of Mother Nature over the coming months will cause at least one significant recovery rally. The energy commodity tends to be as fickle as the weather when it comes to price volatility.
The United States Natural Gas (NYSE:UNG) was trading at $19.46 per share on Tuesday morning, down $0.47 (-2.36%). Year-to-date, UNG has declined -16.55%, versus a 11.05% rise in the benchmark S&P 500 index during the same period.
UNG currently has an ETF Daily News SMART Grade of C (Neutral), and is ranked #51 of 109 ETFs in the Commodity ETFs category.
