- Price failure below the November 2019 high
- It may be too early for a significant rally: A bullish reversal at the end of last week could be technically significant
- Stockpiles are likely to cap the upside – U.S. election could determine the path of least resistance of the price of natural gas
Natural gas rose to a high of $2.743 per MMBtu on the nearby October futures contract on Aug. 28. The price had rallied from a low of $1.70 in late June. While the 61.4% increase was impressive, the continuous NYMEX futures contract rose by 91.5% from the low of $1.432 per MMBtu. Over the past week, gravity hit the natural gas market at the beginning of September.
There are still 11 weeks to go before stockpiles of natural gas in storage across the United States begin to decline during the winter months, which is the peak season of demand for the energy commodity. Inventories were substantially above last year’s level and the five-year average as of the end of August. The rally may have come a bit early for the natural gas market, and the winter season is still a little under three months away.
I had expected a recovery rally in the natural gas market when the price was below the $1.80 per MMBtu level. However, the price action blew away my upside target at the $2.10-$2.16 level. I had been shorting the energy commodity in the futures market and with the KOLD (NYSE:KOLD) ETN product as the price rallied, with very tight stops. At each higher high, I re-entered the short position at each new high and continued to stop out when the price of natural gas reached higher levels.
Over the past week, the strategy was successful as the price corrected. While natural gas rose to a new high for 2020, it was too early for the energy commodity to challenge the November 2019 high at $2.905, the upside target. However, the price action on Friday was decidedly bullish.
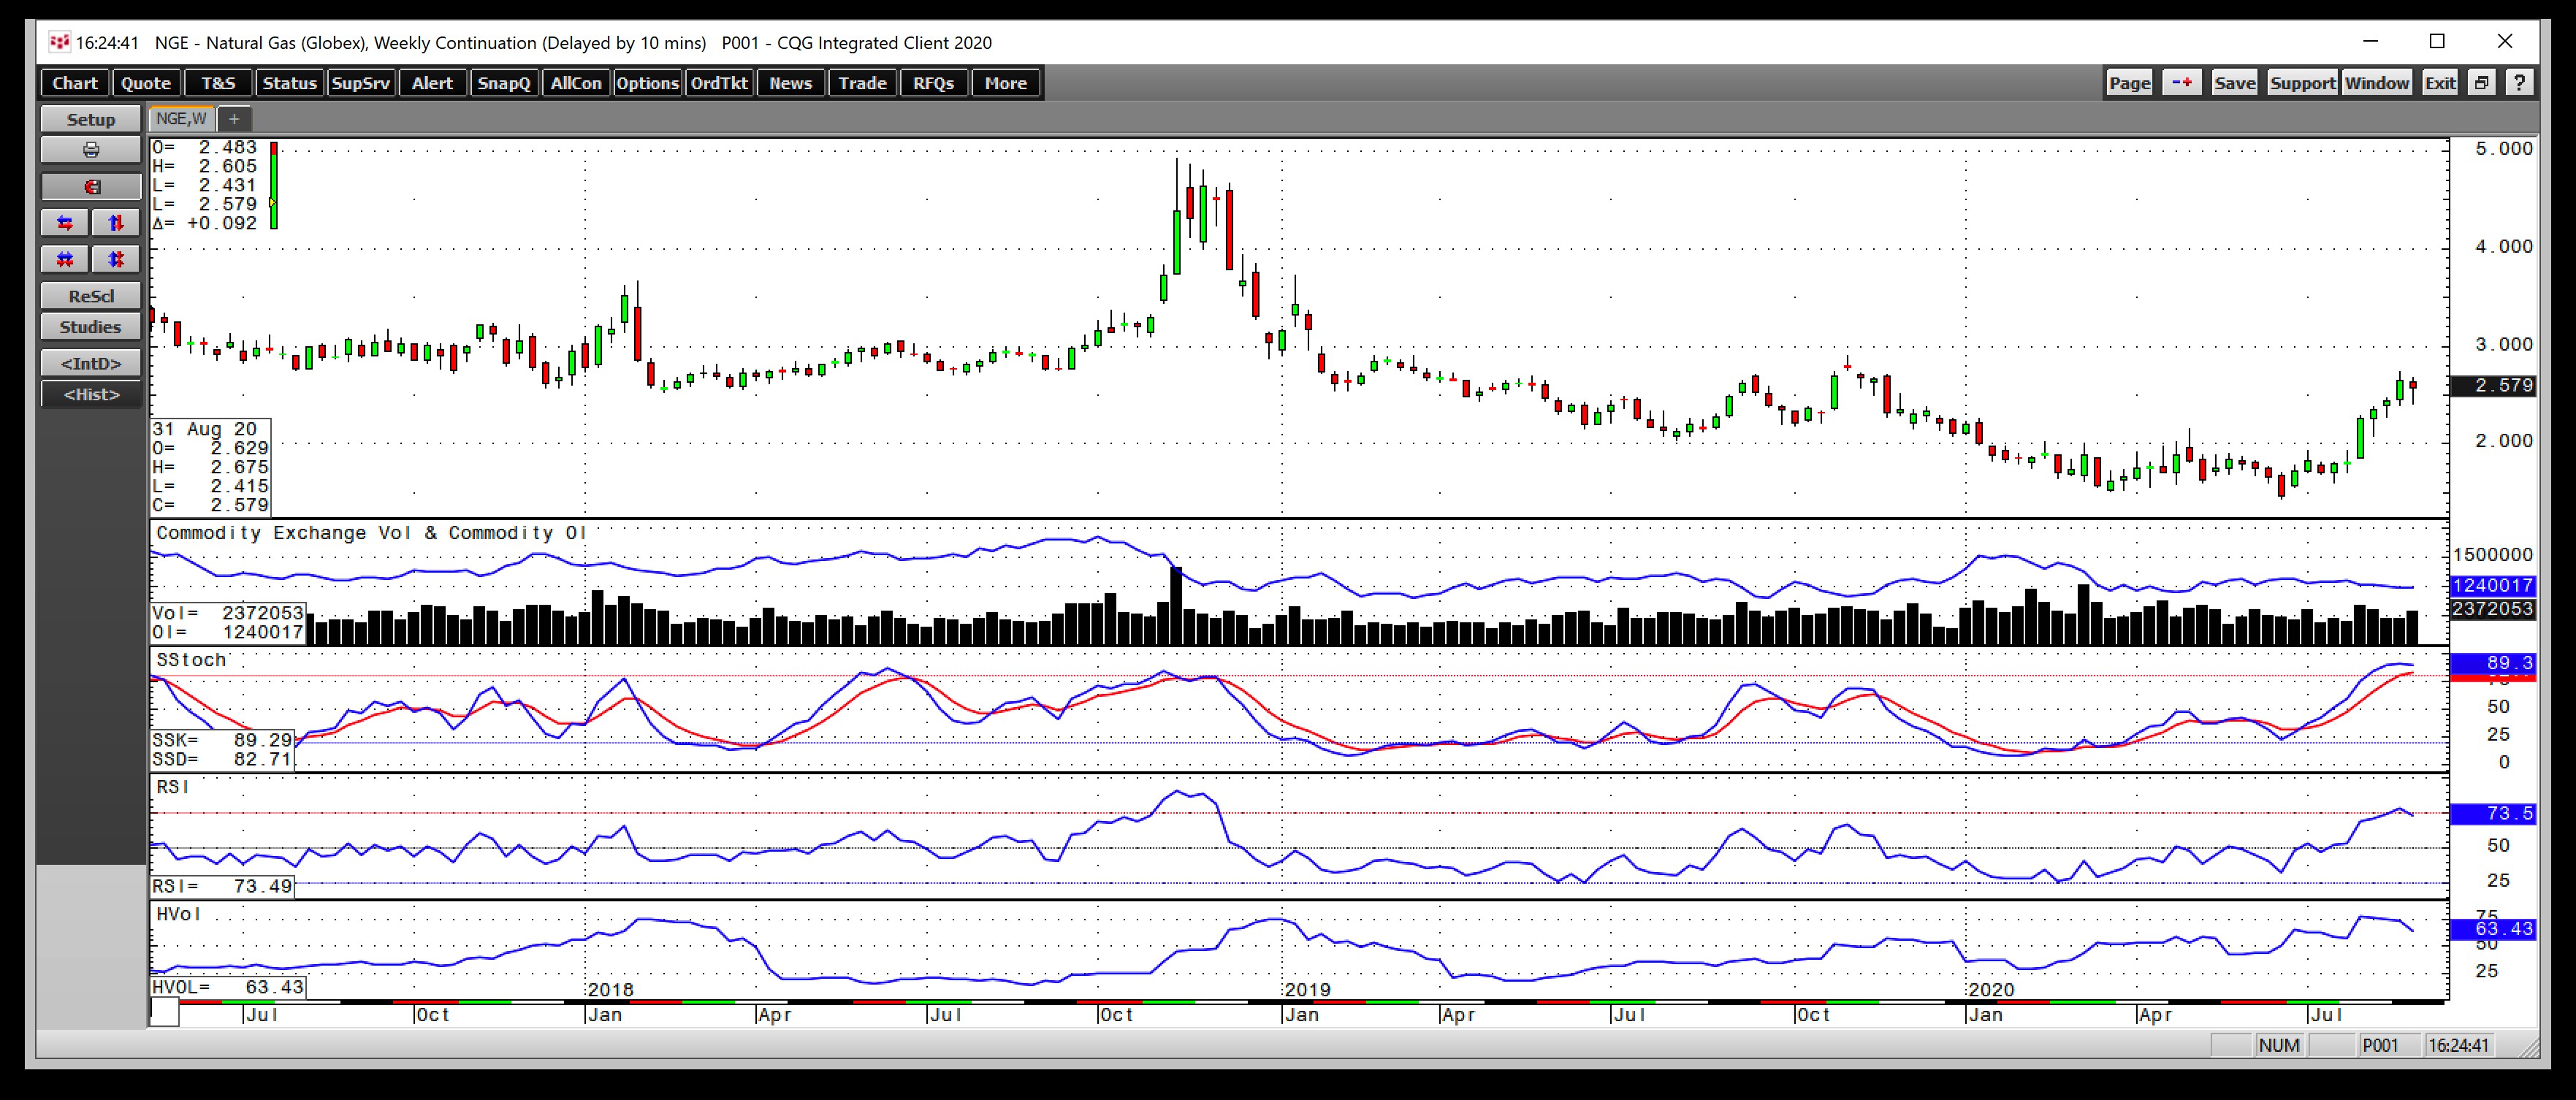
The 91.5% rally from the late June 25-year low took the price of the nearby natural gas contract to a high of $2.743 on Aug. 28.

Source: CQG
As the weekly chart illustrates, the price stopped 16.2 cents per MMBtu shy of the high at the start of the 2019/2020 withdrawal season in the natural gas futures market. After posting gains for six consecutive weeks, natural gas fell last week and settled at the $2.588 per MMBtu level on October futures on Friday, Sept. 4.
The total number of open long and short positions in the natural gas futures arena had been trending slightly lower as the price rallied, which was not a technical validation of the rally. Price momentum and relative strength indicators rose to near overbought conditions but were threatening to cross lower at the end of last week. Weekly historical volatility at 63.43% was edging lower from the recent high of 77.65% in early August when the price broke out to a new high for 2020.
The natural gas futures market experienced an impressive recovery, but the price failed below the technical target at $2.905 per MMBtu.
It May Be Too Early For A Significant Rally: Bullish Reversal At End Of Last Week Could Be Technically Significant
The 91.5% gain on the continuous contract was substantial, but the energy commodity recovered from the lowest price since 1995 in late June. The market was still months away from the peak season for demand, which begins in November.
One sign that natural gas would run out of steam was its failure to spike significantly higher and follow through on the upside as Hurricane Laura approached the states along the coast of the Gulf of Mexico during the final week of August. The delivery point for NYMEX futures is at the Henry Hub in Erath, Louisiana. In 2005 and 2008, Hurricane’s Rita and Katrina pushed the price of the nearby natural gas futures contract above the $10 per MMBtu level. In 2005, the price rose to its all-time peak of $15.65 per MMBtu as the storms wreaked havoc with natural gas infrastructure.
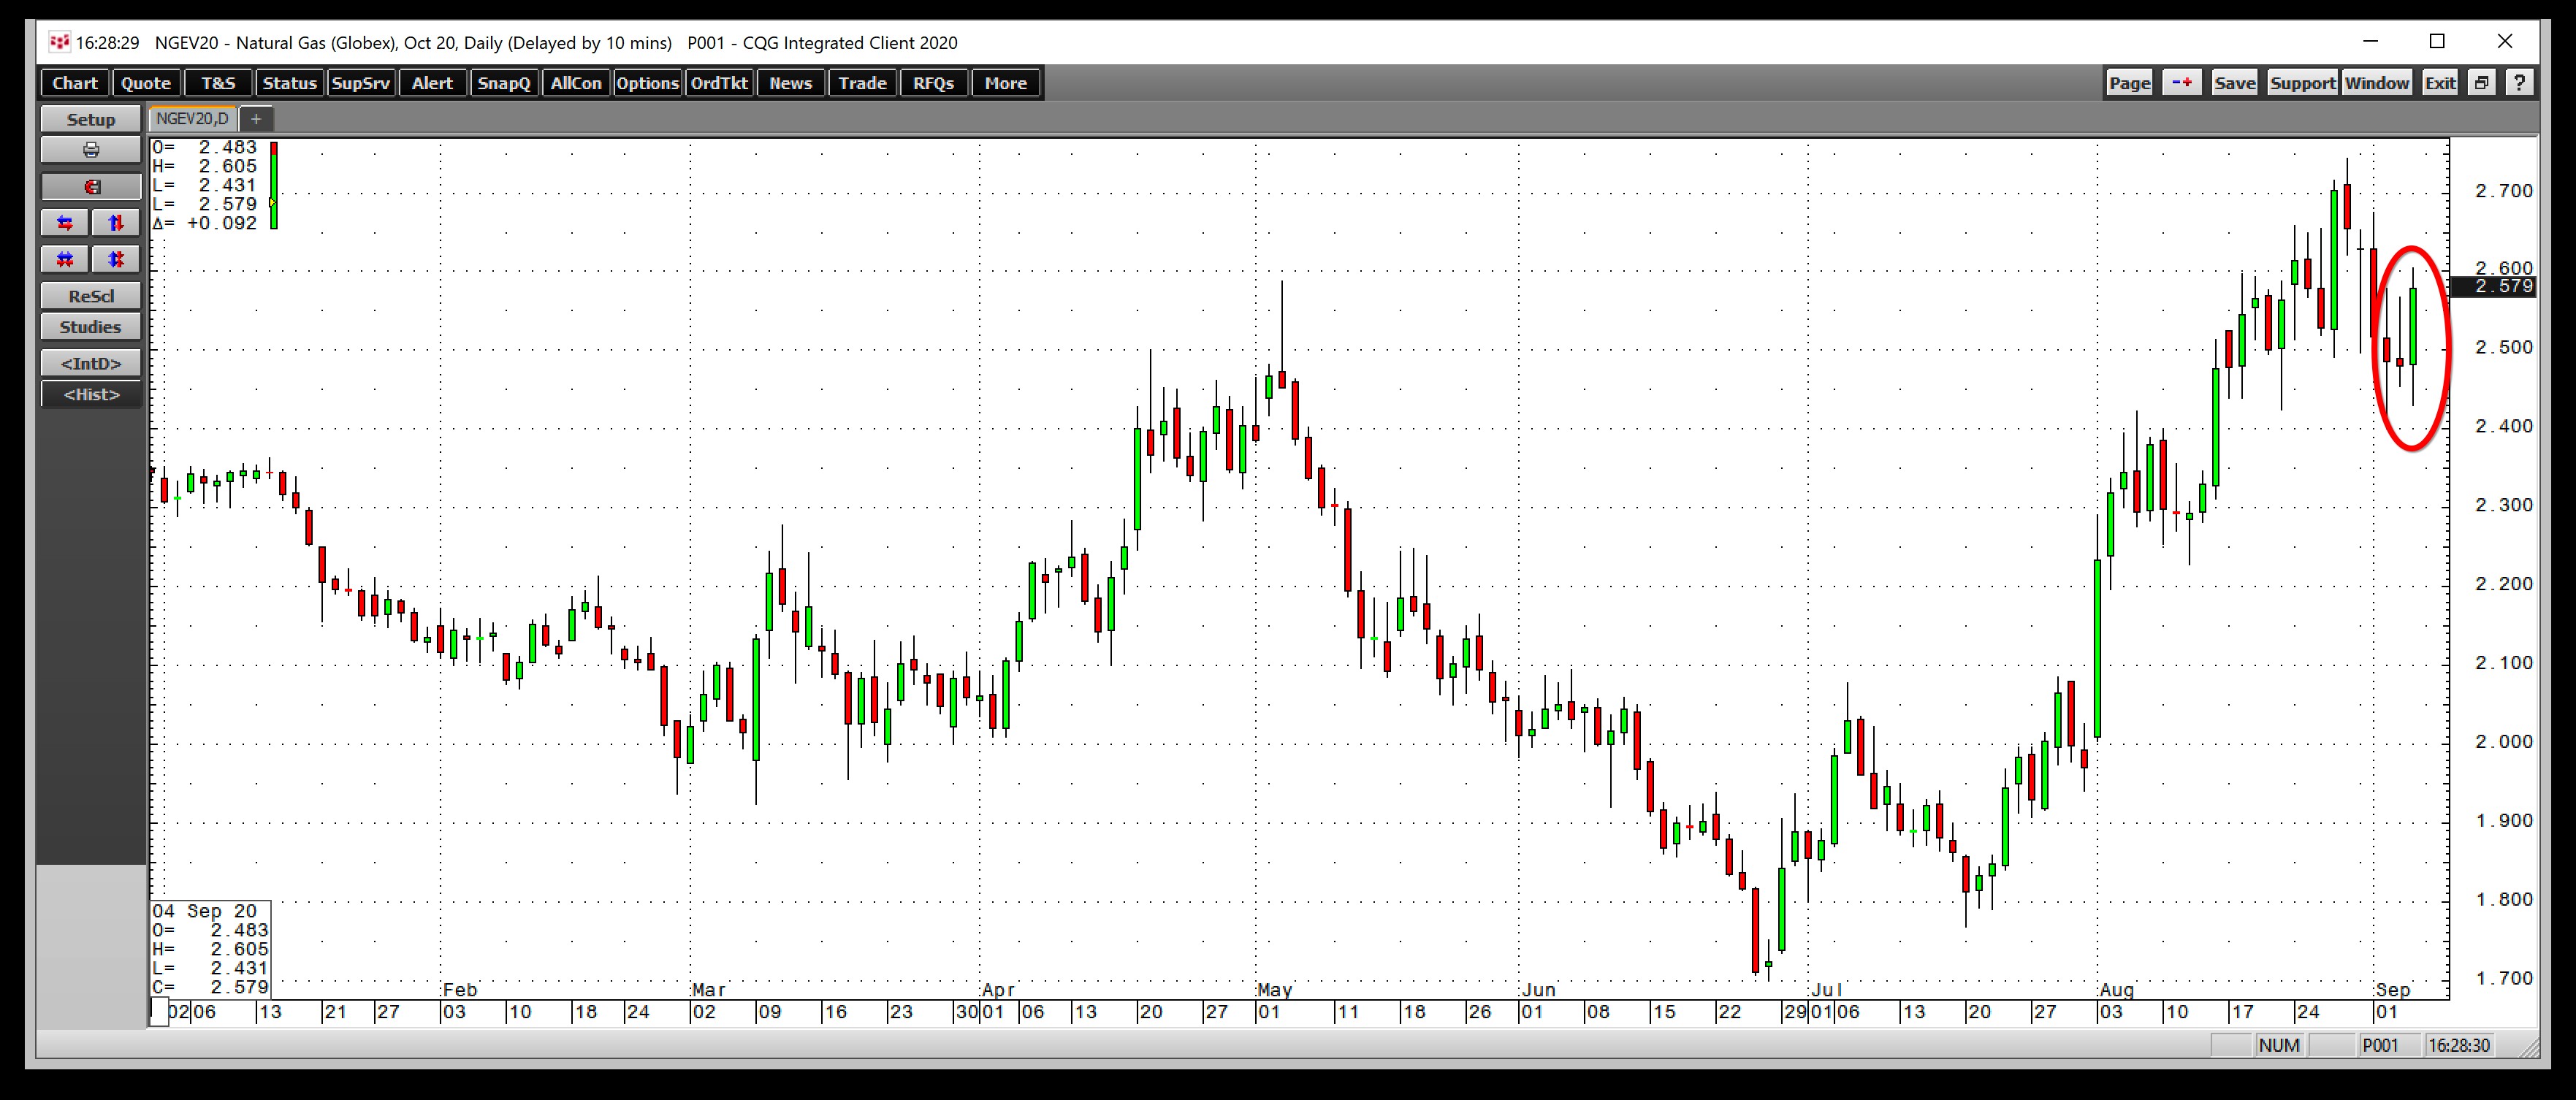
Hurricane Laura, a category 4-plus storm, only sent the price to a high of $2.743 on Aug. 28. In the aftermath of the storm, the price fell back to a low of $2.415 last week. It was too early in the season for a significant rally after the natural gas market weathered the latest storm. Moreover, the levels of natural gas in storage across the U.S. were at an elevated level at the end of August. However, the price action on Friday left the market with a bullish taste in its mouth to think about over the long holiday weekend.

Source: CQG
Natural gas put in a bullish reversal on the daily chart on Sept. 4 as the price fell below the previous day’s low and settled above its high.
Stockpiles Likely To Cap Upside – The U.S. Election Could Determine Path Of Least Resistance For Price Of Natural Gas
Last week, the Energy Information Administration reported an injection of only 35 billion cubic feet into storage. The storm likely caused production to decline. In the crude oil market, the EIA reported that Hurricane Laura caused daily output to drop to an average of 9.7 million barrels per day for the week ending Aug. 28. The average production fell by 1.1 mbpd from the previous week. Therefore, it came as no surprise that the natural gas injection was slightly lower than the market had expected for the same period.
Meanwhile, total stockpiles stood at 3.455 trillion cubic feet at the end of August. At 18.4% above last year’s level and 13.4% over the five-year average for the end of the final month of the summer season, there is plenty of natural gas available for the coming peak season. Natural gas inventories are likely to rise above last year’s peak level at 3.732 tcf, which limited the upside to $2.905 per MMBtu in November 2019. The level of stocks going into the winter months is a bearish factor for the natural gas futures market.
The Nov. 3 U.S. election is, among many other things, a referendum on the future of U.S. energy production. If incumbent President Donald Trump emerges victorious, a second term would mean a continuation of energy initiative that will keep the U.S. in the driver’s seat regarding oil and gas production and independence.
However, former vice-president Joe Biden and Democrats who favor the “Green New Deal” could limit or eliminate fracking in regions across the United States, limiting supplies of oil and gas. The election is a referendum on energy policy, creating uncertainty in the oil and gas futures markets. We could see lots of volatility in crude oil and natural gas futures as the election approaches and in its aftermath.
The contest comes just as the natural gas market will enter the 2020/2021 withdrawal season, which is typically the time of the year when prices move higher because of the uncertainty of the weather conditions during the winter months. Fasten your seat belts as the volatile natural gas market could experience lots of two-way price variance over the rest of this year.
Meanwhile, the October natural gas futures price was just below the $2.60 level on Friday, Sept. 4. I would not be surprised to see it head for $2 based on the current level of inventories, but the bullish reversal caused me to go home with no position over the long weekend in the volatile energy commodity.
