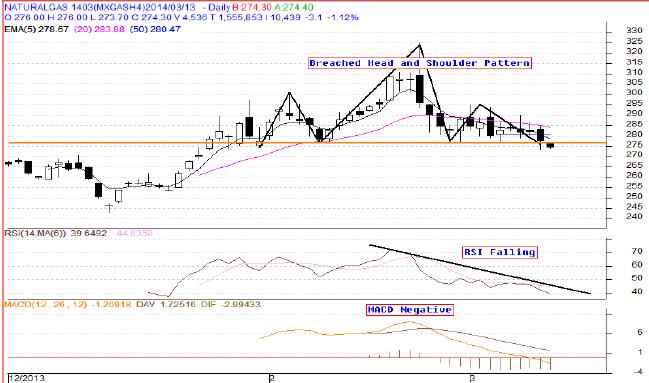
MUMBAI: As seen above in daily price chart of MCX Natural Gas March contract, it was trading in the “Lower top Lower bottom formation” for last couple of days. Broadly it was forming a “Head and Shoulder Pattern” and yesterday it has breached the pattern and trading below it. As per the weekly price formation we noticed that prices are in declining mode from last two weeks after making a high of 325.20 levels.
Indicator Analysis
Prices are trading below its 5, 20 and 50 days EMA (Exponential Moving Average) which is negative for the prices. On the oscillator front, 14 day RSI is falling and currently reading at 44 which indicate pessimism. MACD is also trading in negative zone which is also negative for price trend.
Key Levels
Resistance could be seen at 285 levels and then final resistance will be observed at 305 levels. Prices can find support at level of 265 levels and below that strong support is seen at 250 levels.
Looking at negative chart formation coupled with oscillators indicating pessimism, we recommend Sell on rise in MCX Natural Gas March contract.
Positional Call (5 - 7 Days) - Sell MCX Natural Gas March between 283 – 288, SL – 305, Target – 255 / 250.
- English (UK)
- English (India)
- English (Canada)
- English (Australia)
- English (South Africa)
- English (Philippines)
- English (Nigeria)
- Deutsch
- Español (España)
- Español (México)
- Français
- Italiano
- Nederlands
- Português (Portugal)
- Polski
- Português (Brasil)
- Русский
- Türkçe
- العربية
- Ελληνικά
- Svenska
- Suomi
- עברית
- 日本語
- 한국어
- 简体中文
- 繁體中文
- Bahasa Indonesia
- Bahasa Melayu
- ไทย
- Tiếng Việt
- हिंदी
Natural Gas March On Rise In Selling Recommended
Published 03/13/2014, 07:16 AM
Natural Gas March On Rise In Selling Recommended
Latest comments
Loading next article…
Install Our App
Risk Disclosure: Trading in financial instruments and/or cryptocurrencies involves high risks including the risk of losing some, or all, of your investment amount, and may not be suitable for all investors. Prices of cryptocurrencies are extremely volatile and may be affected by external factors such as financial, regulatory or political events. Trading on margin increases the financial risks.
Before deciding to trade in financial instrument or cryptocurrencies you should be fully informed of the risks and costs associated with trading the financial markets, carefully consider your investment objectives, level of experience, and risk appetite, and seek professional advice where needed.
Fusion Media would like to remind you that the data contained in this website is not necessarily real-time nor accurate. The data and prices on the website are not necessarily provided by any market or exchange, but may be provided by market makers, and so prices may not be accurate and may differ from the actual price at any given market, meaning prices are indicative and not appropriate for trading purposes. Fusion Media and any provider of the data contained in this website will not accept liability for any loss or damage as a result of your trading, or your reliance on the information contained within this website.
It is prohibited to use, store, reproduce, display, modify, transmit or distribute the data contained in this website without the explicit prior written permission of Fusion Media and/or the data provider. All intellectual property rights are reserved by the providers and/or the exchange providing the data contained in this website.
Fusion Media may be compensated by the advertisers that appear on the website, based on your interaction with the advertisements or advertisers.
© 2007-2025 - Fusion Media Limited. All Rights Reserved.

