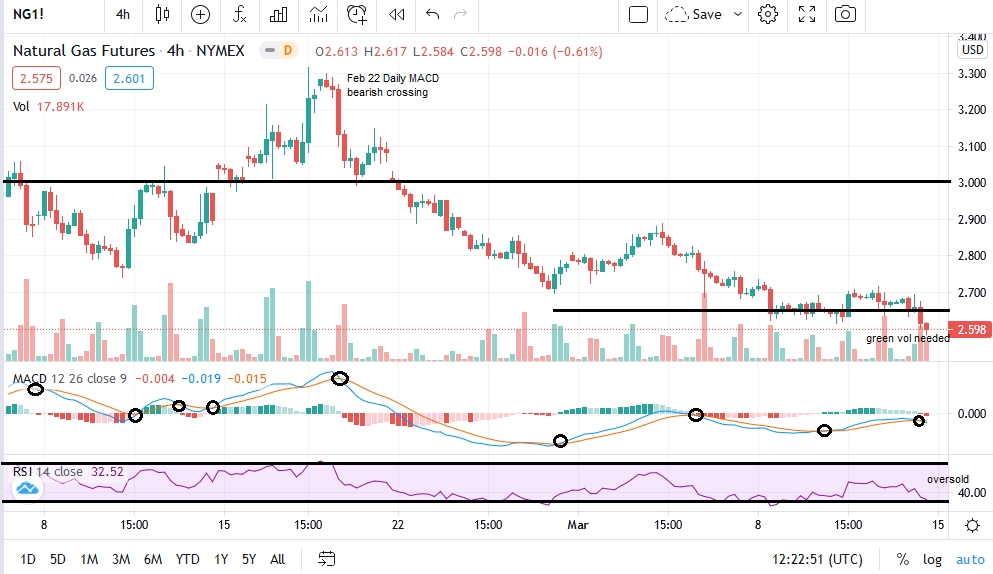
Natural Gas futures on the Nymex had another negative week before closing 3.7% lower than the previous one at $2.59. EIA confirmed on Thursday a rather bearish withdrawal for this time of year of 52 Bcf in working underground stocks for the week ended March 5. Inventory is currently at 1,793 Bcf, 12.5% lower y/y, 7.3% below the 5-year average.
Price fell naturally from old resistance on a continuation of this post-winter downtrend and it has reached a crucial level around $2.60-$2.70 where we need to see new resistance being formed after a short bounce so we can trade with more confidence towards new lows. The market as expected could not found fresh buying volumes at $3.00. We have considered this move on blizzards as another selling opportunity. We had already seen and took a touch-and go twice at $2.25 in the middle of winter, but calendar analysis will soon come to play again as the market will move on and trade the summer contracts on larger volumes. Resistance at $2.60 is what we want to see now. RSI has been looking oversold so let's operate cautiously and not becoming too greedy about this seasonal idea while shorting the near term charts on exhaustion. Besides, a floor is what we are going to be looking for in a couple of months from now if the market continues to behave typically enough.
We have talked many times about how the 2016 price lows are still shaping this market's seasonality and overall sentiment. Demand for Natural Gas last week fell to lowest levels for the same week since 2016. The gas-fired electricity generation market share will be crucial going forward. Last refill season closed with 30% lower demand for Natural Gas in the United States. The domestic market share is very important for American producers as it absorbs more than 90% of total production. U.S. macro data and the Dollar Index to be routinely monitored. Daily, 4hour, 15min MACD and RSI are pointing to entry areas. 
- English (UK)
- English (India)
- English (Canada)
- English (Australia)
- English (South Africa)
- English (Philippines)
- English (Nigeria)
- Deutsch
- Español (España)
- Español (México)
- Français
- Italiano
- Nederlands
- Português (Portugal)
- Polski
- Português (Brasil)
- Русский
- Türkçe
- العربية
- Ελληνικά
- Svenska
- Suomi
- עברית
- 日本語
- 한국어
- 简体中文
- 繁體中文
- Bahasa Indonesia
- Bahasa Melayu
- ไทย
- Tiếng Việt
- हिंदी
Natural Gas Looking At New Resistance
Published 03/13/2021, 08:09 AM
Updated 07/09/2023, 06:32 AM
Natural Gas Looking At New Resistance
Latest comments
Loading next article…
Install Our App
Risk Disclosure: Trading in financial instruments and/or cryptocurrencies involves high risks including the risk of losing some, or all, of your investment amount, and may not be suitable for all investors. Prices of cryptocurrencies are extremely volatile and may be affected by external factors such as financial, regulatory or political events. Trading on margin increases the financial risks.
Before deciding to trade in financial instrument or cryptocurrencies you should be fully informed of the risks and costs associated with trading the financial markets, carefully consider your investment objectives, level of experience, and risk appetite, and seek professional advice where needed.
Fusion Media would like to remind you that the data contained in this website is not necessarily real-time nor accurate. The data and prices on the website are not necessarily provided by any market or exchange, but may be provided by market makers, and so prices may not be accurate and may differ from the actual price at any given market, meaning prices are indicative and not appropriate for trading purposes. Fusion Media and any provider of the data contained in this website will not accept liability for any loss or damage as a result of your trading, or your reliance on the information contained within this website.
It is prohibited to use, store, reproduce, display, modify, transmit or distribute the data contained in this website without the explicit prior written permission of Fusion Media and/or the data provider. All intellectual property rights are reserved by the providers and/or the exchange providing the data contained in this website.
Fusion Media may be compensated by the advertisers that appear on the website, based on your interaction with the advertisements or advertisers.
© 2007-2025 - Fusion Media Limited. All Rights Reserved.
