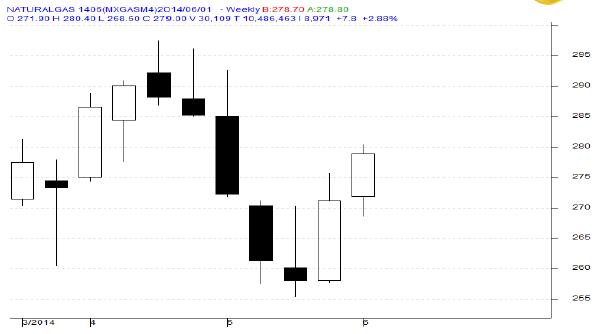
MCX Natural Gas June as seen in the weekly chart above has opened the week at 271.90 levels and it made a low of 268.60 levels. As expected prices could not able to sustain on lower levels and bounced back towards the weekly high of 280.40 levels. At the same time price have breached preceding three week’s high and trading above it and formed a “Bullish candlestick pattern” which is the sign of optimism. Finally prices have closed 2.88% higher at 279 levels.
For the next week we expect Natural Gas prices to find support in the range of 273 - 272 levels. Trading consistently below 272 levels would lead towards the strong support at 264 levels.
Resistance is now observed in the range of 285 - 288 levels. Trading consistently above 288 levels would lead towards the strong resistance at 295 levels, and then finally towards the major resistance at 305 levels.
MCX / NYMEX Natural Gas Trading levels for the week
Trend: Up
S1 - 272 / $ 4.50 R1 - 288 / $ 4.90
S2 - 264 / $ 4.30 R2 - 295 / $ 5.10
Weekly Recommendation: Buy MCX Natural Gas June between 272 - 273, SL - 264, Target – 288 / 292.

