Natural gas futures climbed to their highest price in nearly two and a half years ,Thursday, after a government storage report showed a supply decline last week that was greater than normal for this time of year. Meanwhile, weather forecasts continue to project more frigid temperatures later this month. Natural gas for January delivery settled 7.2 cents higher, or 1.7%, to $4.409 a million British thermal units on the New York Mercantile Exchange. Prices rose to their highest level since July 20, 2011 and have gained 27% since in Nov 5. Recently, Natural gas is trading near day low 4.346

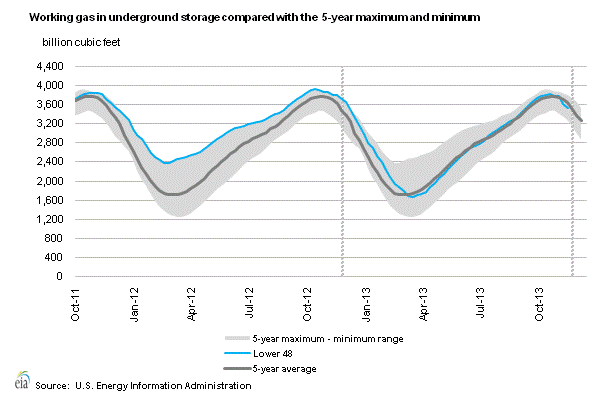
Working gas in storage was 3,533 Bcf as of Friday, December 6, 2013, according to EIA estimates. This represents a net decline of 81 Bcf from the previous week. Stocks were 273 Bcf less than last year at this time and 109 Bcf below the 5-year average of 3,642 Bcf. In the East Region, stocks were 155 Bcf below the 5-year average following net withdrawals of 46 Bcf. Stocks in the Producing Region were 41 Bcf above the 5-year average of 1,173 Bcf after a net withdrawal of 9 Bcf. Stocks in the West Region were 6 Bcf above the 5-year average after a net drawdown of 26 Bcf. At 3,533 Bcf, total working gas is within the 5-year historical range.
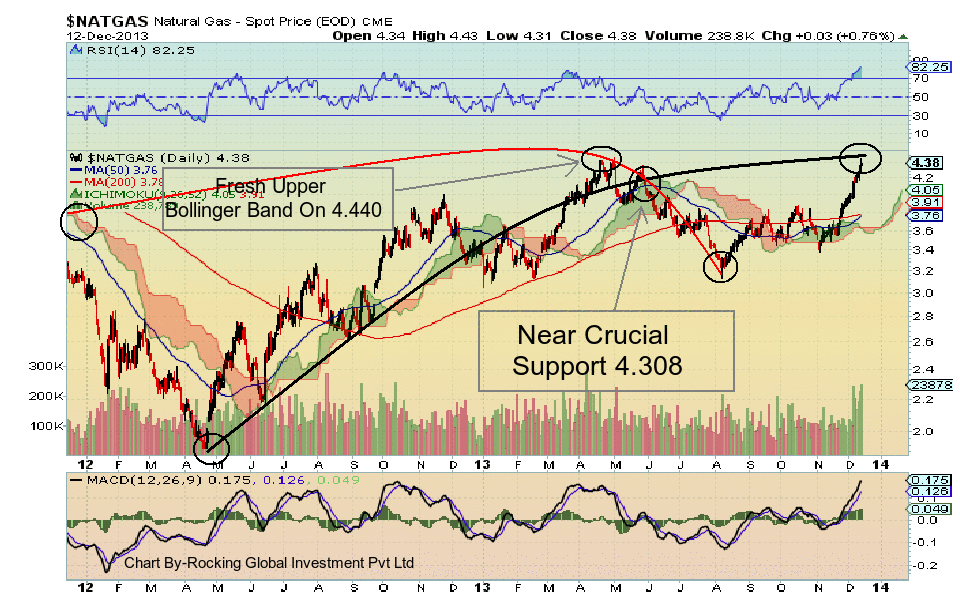
Natural gas creates on 2 year historical chart a format of inverted head and shoulder as a reversal in a down trend it indicated that natural gas bullish trend will continue on near main support 4.308. You can see more selling pressure level 4.270 and 4.233 with profit booking if natural gas breaks its near crucial support 4.308 and give close in it. Weekly bullish trend 50% retrenchment completes around 4.308. Natural gas fresh upper Bollinger band may start above 4.440. You can see more upside level 4.476 and 4.500 if natural gas crosses its crucial resistance 4.440 and gives close on it. Natural gas may hit 4.270 and 4.233 in short term with profit booking.
- English (UK)
- English (India)
- English (Canada)
- English (Australia)
- English (South Africa)
- English (Philippines)
- English (Nigeria)
- Deutsch
- Español (España)
- Español (México)
- Français
- Italiano
- Nederlands
- Português (Portugal)
- Polski
- Português (Brasil)
- Русский
- Türkçe
- العربية
- Ελληνικά
- Svenska
- Suomi
- עברית
- 日本語
- 한국어
- 简体中文
- 繁體中文
- Bahasa Indonesia
- Bahasa Melayu
- ไทย
- Tiếng Việt
- हिंदी
Natural Gas Futures Soar On Supply
Published 12/13/2013, 08:48 AM
Updated 07/09/2023, 06:32 AM
Natural Gas Futures Soar On Supply
Latest comments
Loading next article…
Install Our App
Risk Disclosure: Trading in financial instruments and/or cryptocurrencies involves high risks including the risk of losing some, or all, of your investment amount, and may not be suitable for all investors. Prices of cryptocurrencies are extremely volatile and may be affected by external factors such as financial, regulatory or political events. Trading on margin increases the financial risks.
Before deciding to trade in financial instrument or cryptocurrencies you should be fully informed of the risks and costs associated with trading the financial markets, carefully consider your investment objectives, level of experience, and risk appetite, and seek professional advice where needed.
Fusion Media would like to remind you that the data contained in this website is not necessarily real-time nor accurate. The data and prices on the website are not necessarily provided by any market or exchange, but may be provided by market makers, and so prices may not be accurate and may differ from the actual price at any given market, meaning prices are indicative and not appropriate for trading purposes. Fusion Media and any provider of the data contained in this website will not accept liability for any loss or damage as a result of your trading, or your reliance on the information contained within this website.
It is prohibited to use, store, reproduce, display, modify, transmit or distribute the data contained in this website without the explicit prior written permission of Fusion Media and/or the data provider. All intellectual property rights are reserved by the providers and/or the exchange providing the data contained in this website.
Fusion Media may be compensated by the advertisers that appear on the website, based on your interaction with the advertisements or advertisers.
© 2007-2024 - Fusion Media Limited. All Rights Reserved.
