-
A surprise rally catches some shorts sleeping
-
The target is just above $2 per MMBtu
-
Will selling emerge again?
Spring is a time of the year for new beginnings. As the sun begins to break through the cold and cloudy winter months, birds start to sing, plants pop out of the ground, and more people venture from their homes for outdoor activities. The start of the spring season in 2020 is a lot different than in past years. The global pandemic continues to spread around the globe like wildfire. Many people in nonessential roles in the global economy remain sheltered in place, only going out for groceries, medicine, or a brief period of exercise. The future of the lockdown is in the hands of the scientists working on treatments and a vaccine for the virus. Central banks and governments have been treating the financial symptoms with unprecedented amounts of monetary and fiscal stimulus to stabilize the economy until the pandemic recedes. The human and economic toll will be high, and the legacy of Coronavirus will outlive its threat to human life and wellbeing.
Most markets have responded to the pandemic with increased price variance in an overall deflationary environment. However, the price action in the natural gas market could be telling us that the energy commodity has blinders on as the price moved higher in what was a typical spring rally over the past week. At the start of the injection season, the price action in the natural gas arena appears typical in a period that is far from ordinary. The United States Natural Gas Fund (NYSE:UNG) is the ETF product that tracks the price action of nearby NYMEX natural gas futures.
A surprise rally catches some shorts sleeping
At the end of March, the price of nearby NYMEX natural gas futures fell to the lowest level since 1995 at $1.519 per MMBtu. On April 2, May futures declined to within two ticks or $0.002 of that bottom.

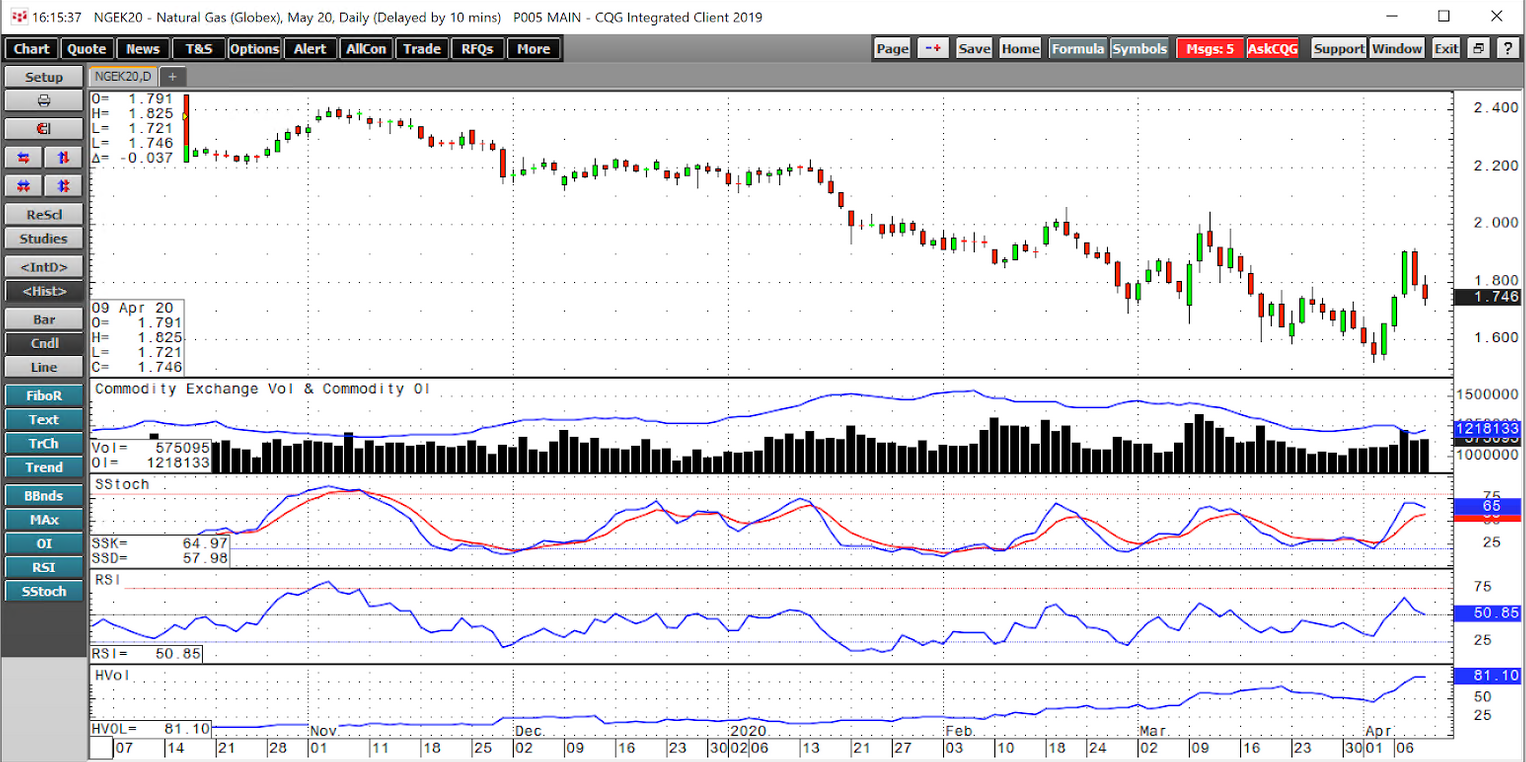
(Source: CQG)
As the daily chart of May futures highlights, the April 2 low gave way to another in a long series of price recoveries that took natural gas to a high of $1.918 per MMBtu on April 8, a rise of 26.1%. The rally ran out of steam before the Energy Information Administration reported its first injection of the year last Thursday.
Natural gas turned lower after making another lower high. At the end of last week, both price momentum and relative strength indicators were heading lower, but both remained at or above neutral readings. The total number of open long and short positions declined from the peak season high of 1.54 million contracts in early February to 1.218 million on April 9, a drop of 322,000 contracts, or 20.9%. Wider daily price ranges over recent trading sessions pushed daily historical volatility to 81.1%, the highest level of 2020. Last week’s rally caught some shorts sleeping and caused them to cover risk positions and flock to the sidelines.
The target is just above $2 per MMBtu
The pattern of lower highs and lower lows in the natural gas futures arena has been in place since early November 2019. Ending that pattern requires the price to surpass the March 11 high of $2.044 and the February 20 peak at $2.06 per MMBtu.
The technical and fundamental position of the natural gas market remained bearish at the end of last week. Inventories in storage across the United States ended the 2019/2020 withdrawal season 879 billion cubic feet above last year’s level at 1.986 tcf. The price failed at over the $1.90 level again and was under $1.75 at the end of last week. In a typical year, natural gas tended to reach a seasonal low at the end of the winter months, but Coronavirus has made 2020 anything but ordinary. Lower energy demand threatens to keep the bearish price action going in the natural gas market, but the energy commodity is often full of surprises.
Will selling emerge again?
The odds favor that the move to $1.519 per MMBtu was the low for the year in the natural gas futures market. While demand has declined, so will production. Debt-laden producers of the energy commodity have little incentive to extract natural gas from the crust of the earth in the United States at current prices. At the same time, many are facing bankruptcy unless the US government provides significant bailouts. Moreover, the industry could feel the impact of Coronavirus, which may cause many workers to stay home, further decreasing supplies.
Commodity prices tend to fall to price levels where production declines, inventories fall, and demand increases. We could see natural gas reflect the dynamics of its pricing cycle later this year as the winter months approach. While the price of nearby May futures settled at $1.733, peak season January 2021 futures were at $2.901, $1.168 per MMBtu, or 67.4% above the nearby price. The forward curve in natural gas is telling us that we should expect higher prices over the coming months.
Spring has arrived in the natural gas market, and the price trend remains lower. However, the odds of a recovery that ends the bearish price pattern since November are rising. The market that loves to surprise could be preparing to rise above the $2 level sooner rather than later and take out the technical resistance levels
