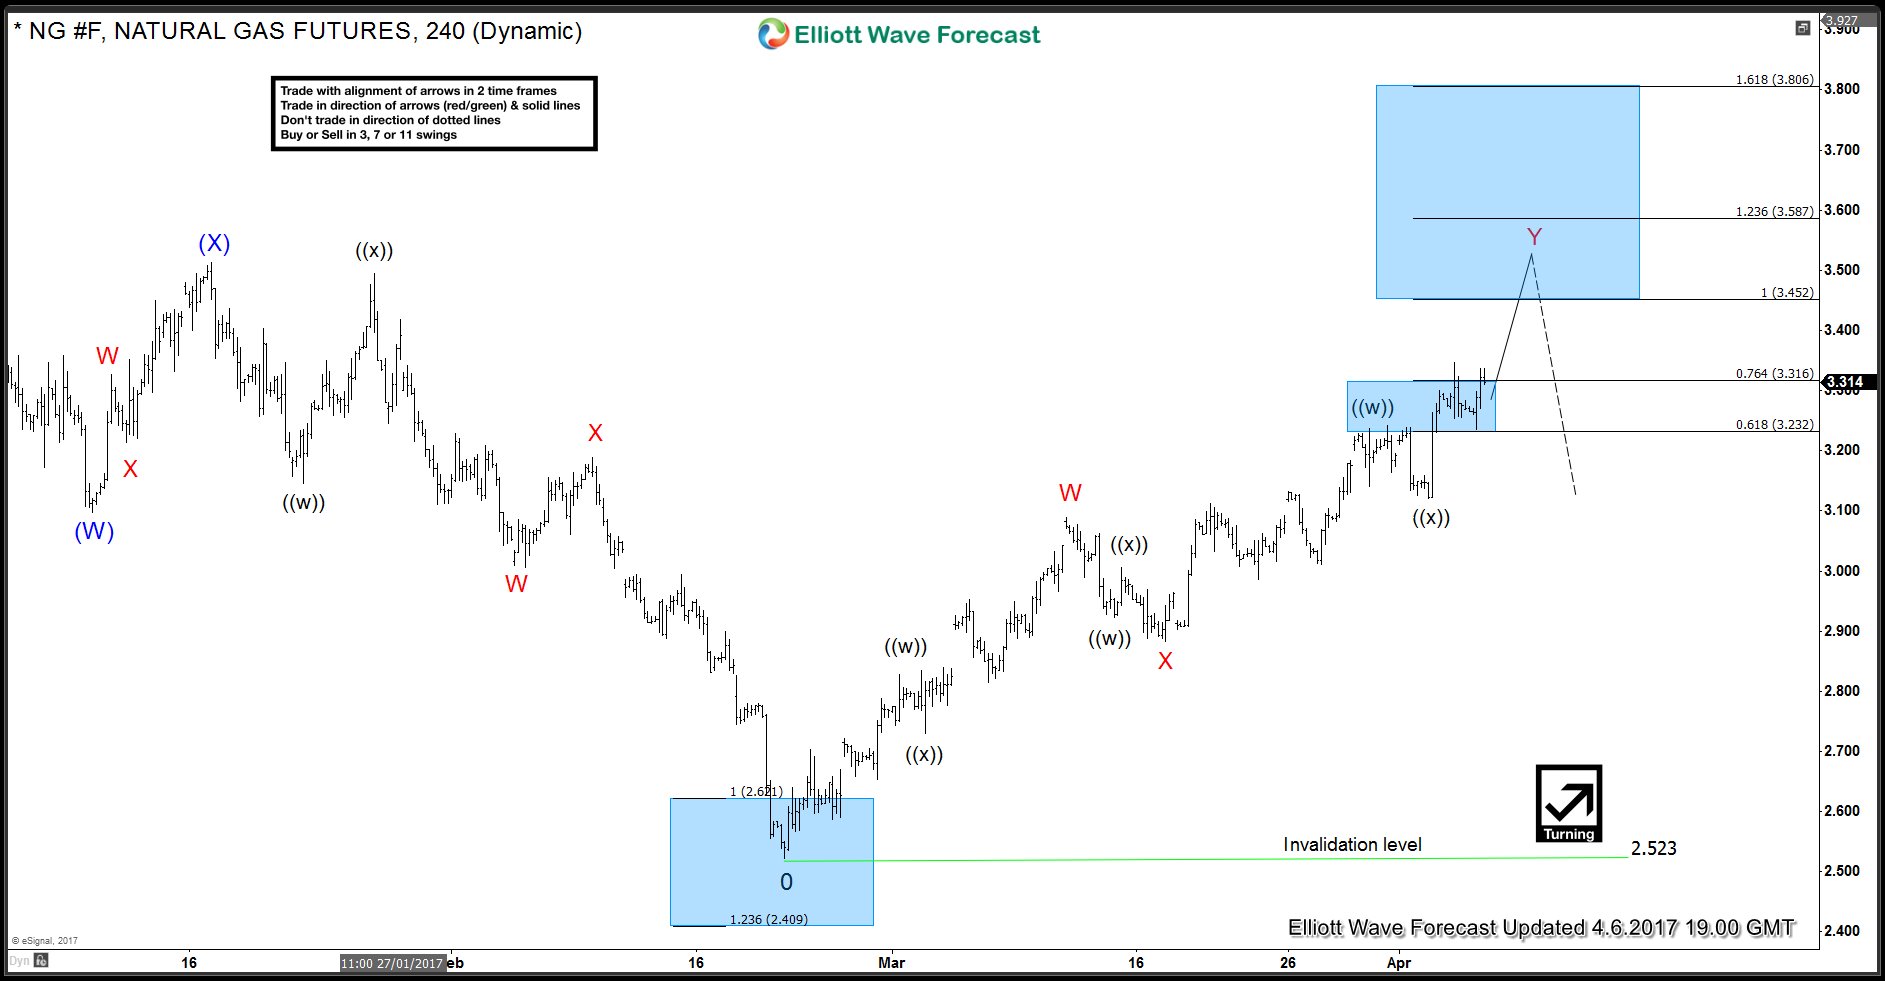
Natural gas has been rallying since forming a low on 2/22 (2.523). Rally is unfolding as a WXY or double three Elliott Wave Structure where wave W completed at 3.089 and wave X completed at 2.882. Up from red X low, natural gas is showing 5 swings up which means the sequence is incomplete and while above black ((x)) low at 3.121, rally should continue higher towards 3.452 – 3.587 to complete 7 swings sequence from red X low. This would also complete a WXY structure from 2.523 low and then we should see a 3 wave pull back in NG #F either to correct the cycle from 2.523 low or at least from red X low.
Natural Gas 4 Hour Elliott Wave Chart
Natural Gas 1 Hour Elliott Wave Chart
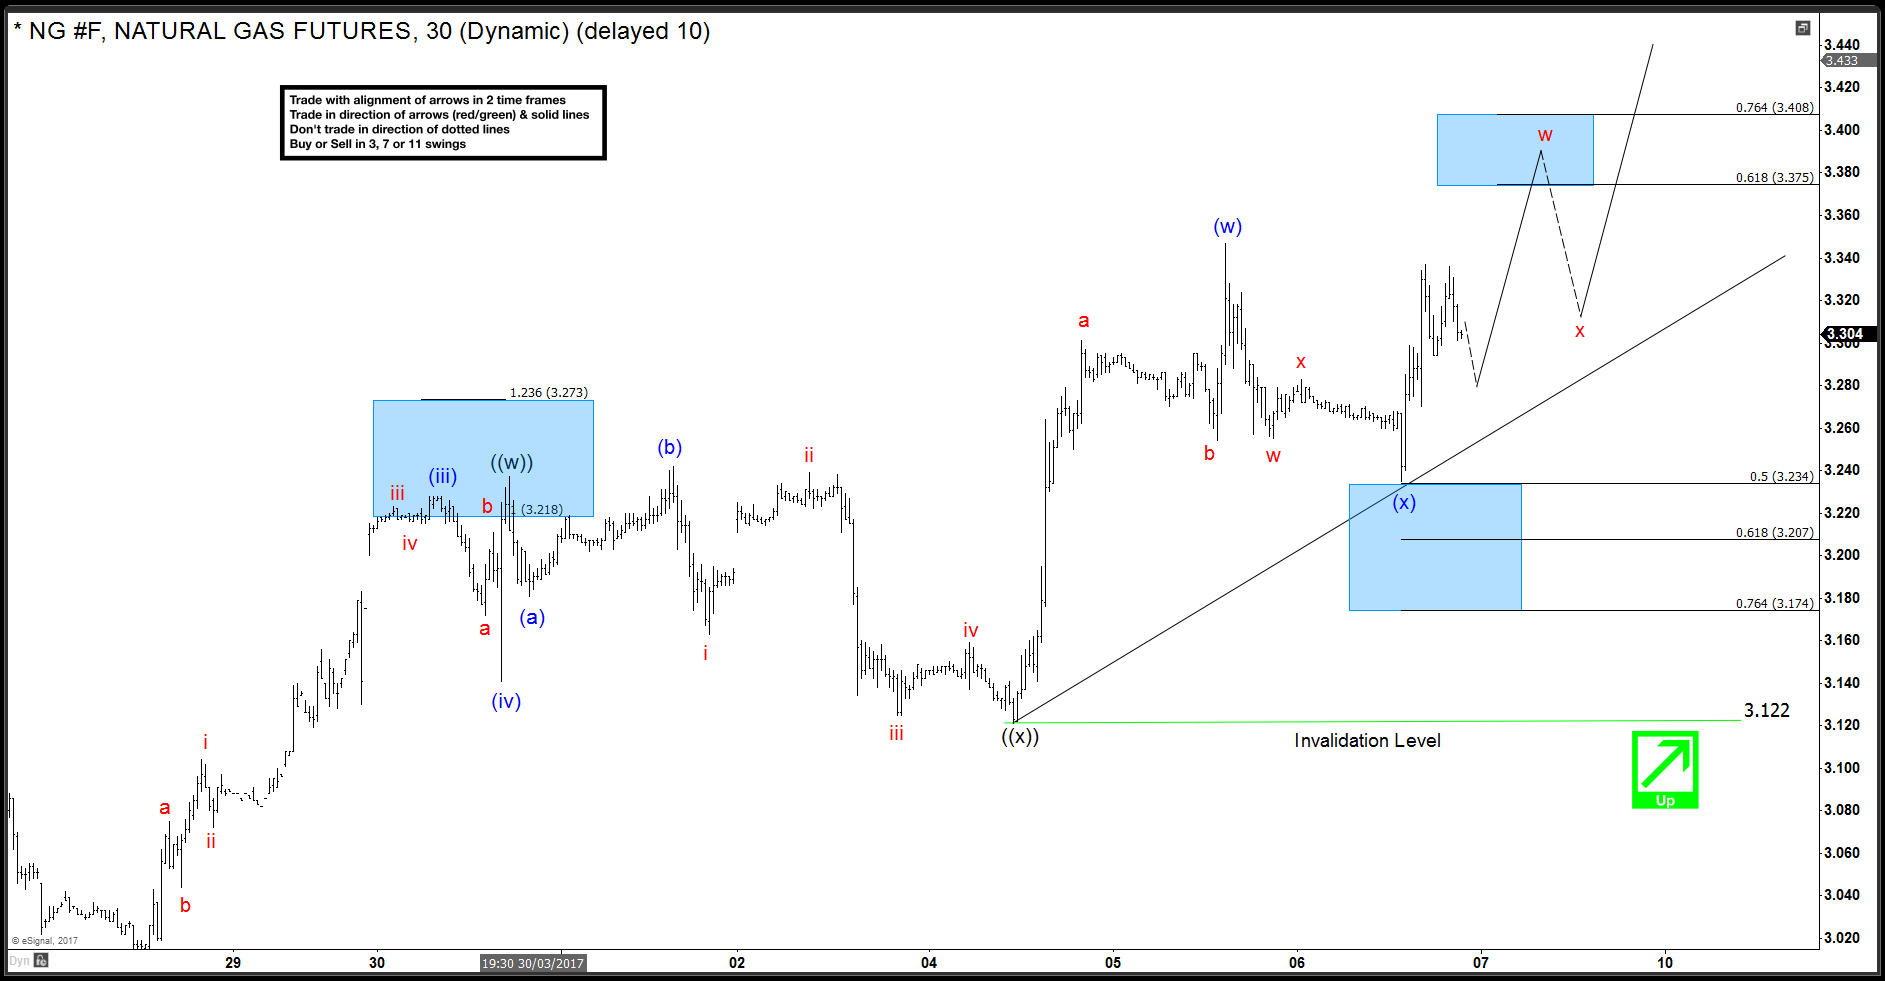
Rally to 3.237 completed wave ((w)) which was followed by a FLAT correction to 3.121 which completed wave ((x)). Up from there, it rallied in 3 waves to 3.347 to complete wave (w) and then did a 3 wave pull back to 50 Fibonacci retracement level at 3.234 which we think completed wave (x). Today, natural gas started rallying again and now it needs to break above 3.347 (w) high to confirm wave (x) completed at 3.234 and wave (y) higher is in progress. Until 3.347 high doesn’t break a test of 3.224 – 3.197 area can’t be ruled out to complete a double three correction in wave (x). Break above 3.347 would initially expose a test of 3.375 – 3.408 area and from there we can see another 3 wave pull back followed by the next leg higher towards 3.461 – 3.514 area which is the 100 – 123.6 Fibonacci extension area of (w)-(x) and will coincide with 100% Fibonacci extension of higher degree red W-X at 3.452.


