One does not have to cherry pick the data right now to make a case the economy is sucking swamp water. On the other hand, there remains no smoking gun showing the economy has slipped into a recession.
Trade data is one of the major data releases used to validate Econintersect‘s Economic Index. With CNBC providing the background noise in my world, I noticed little discussion occurred about this data. On the surface, the trade balance deficit grew – and this should be good news as the trade balance deficit normally grows when the USA economy is expanding. But is it different this time?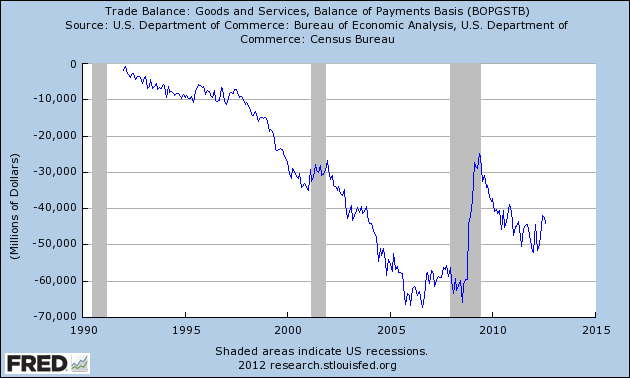
From the perspective of the above graph, all looks in order. Remember, the trade balance is the subtraction of imports from exports. Trade balance does not tell you if exports or imports are growing. What would it say about the economy if both exports and imports were in a long term “less good” trend?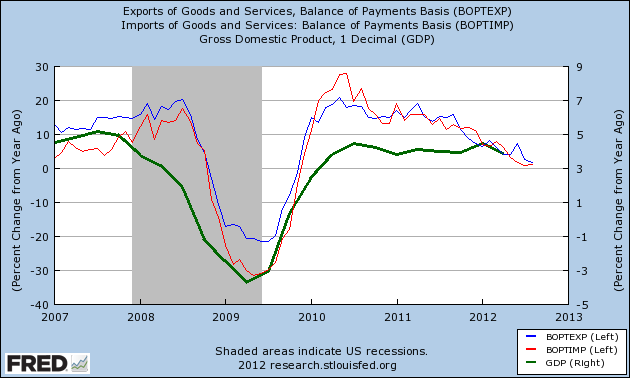
The above graph uses seasonally adjusted data and tells you that year-over-year economic growth is almost zilch. And for grins, I have tossed in GDP to show historical correlations.
However, both export and import prices have been deflating. The graph below uses unadjusted data – and uses the export and import price indices to show inflation adjusted growth.
Inflation Adjusted Year-over-Year Change Exports (blue line), Imports less Oil (black line), and Imports with Oil (red line)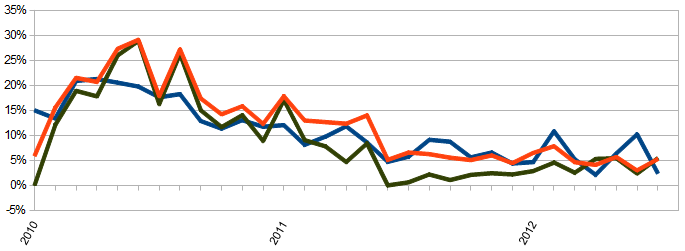
So what is the bottom line?
The trade balance is a major influence of the USA GDP. This trade balance was 0.23 of the 1.3% 2Q2012 GDP. But we now have two months of 3Q2012 with marginal data – and a growing trade balance. This could turn out to be a major GDP headwind.
Unadjusted Total Imports (blue line), Exports (red line) and Trade Balance (green line) indexed to the End of Recession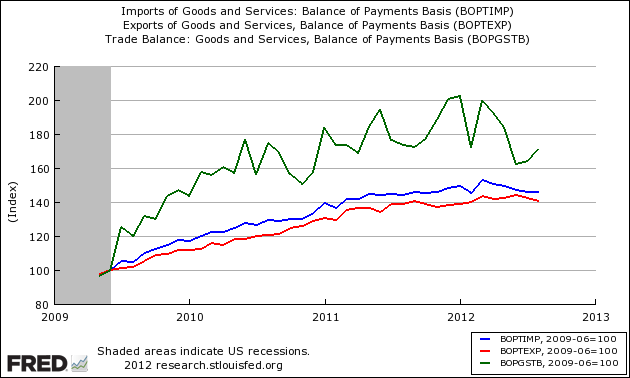
The trade data normally has almost unnoticeable current dollar backward revision. If the upcoming September data does not improve – trade will be a significant headwind to GDP. As Econintersect concentrates on the Main Street economy, import’s marginal growth suggests Joe Sixpack’s world continues marginal consumption improvement.
No data is yet suggesting a reversal to the economy’s current weakening trend.
Other Economic News this Week:
The Econintersect economic forecast for October 2012 showed growth, but there was a serious degradation of the elements in the forecast. Overall, trend lines were broken to the downside. There is a whiff of recession in the hard data (plus certain surveys are actually at recession levels), with container imports contracting for three months in a row.
ECRI is still insisting a recession is here (a 07Sep2012 post on their website). ECRI first stated in September 2011 a recession was coming . The size and depth is unknown. The ECRI WLI growth index value is enjoying its eighth week in positive territory. The index is indicating the economy six month from today will be slightly better than it is today.
Current ECRI WLI Growth Index 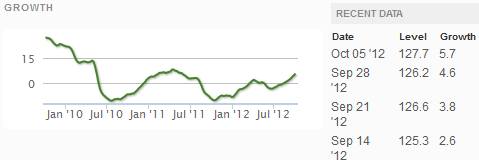
Initial unemployment claims fell significantly – from 367,000 (reported last week) to 339,000 this week. Historically, claims exceeding 400,000 per week usually occur when employment gains are less than the workforce growth, resulting in an increasing unemployment rate (background here and here). The real gauge – the 4 week moving average – also fell significantly from 375,000 (reported last week) to 364,000. Because of the noise (week-to-week movements from abnormal events AND the backward revisions to previous weeks releases), the 4-week average remains the reliable gauge.
Weekly Initial Unemployment Claims – 4 Week Average – Seasonally Adjusted – 2010 (blue line), 2011 (red line), 2012 (green line) 
Data released this week which contained economically intuitive components (forward looking) were:
- Rail movements (where the economic intuitive components continue to be indicating amoderately slightly expanding economy).
- ISM services Business Activity sub-index, which has a good new normal track record in tracking the economy, grew strongly.
Click here to view the scorecard table below with active hyperlinks.
Bankruptcies this Week: Vertis Holdings, Privately-held TC Global (dba Tully’s Coffee)
