
Nasdaq, Inc. (NASDAQ:NDAQ) reported fourth-quarter 2017 adjusted earnings per share of $1.05, beating the Zacks Consensus Estimate of $1.01. The bottom line improved 11% year over year.
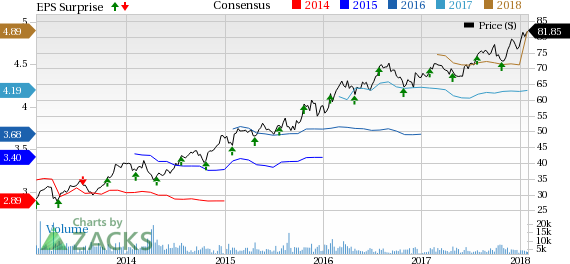
Nasdaq, Inc. Price, Consensus and EPS Surprise
Higher revenues as well as growth across the segments namely Market Services, Information Services and Market Technology supported this upside. However, the upside was limited by an increase in expenses.
On a GAAP basis, the company’s net income was $1.45 per share, rebounding from the year-ago loss of $1.35.
Shares of Nasdaq inched up about 0.8% in pre-market trading session, reflecting the outperformance.
Performance in Detail
Nasdaq’s revenues recorded $635 million, improved 6% year over year. The top line beat the Zacks Consensus Estimate of $628 million, primarily owing to organic growth of $17 million, a $12-million favorable impact on the back of changes in forex rates and a $7-million impact from acquisitions.
Adjusted operating expenses were $341 million in the reported quarter, up 5% from the year-ago figure. This represents a $16-million increase from buyouts and a $7-million unfavorable impact from changes in foreign exchange rates, partially offset by a $6-million organic expense decrease.
Nasdaq guided 2018 non-GAAP operating expense to the range of $1.375-$1.415 billion.
Segment wise, net revenues at Market Services nudged up 0.9% from the year-ago quarter to $222 million. This upside was driven by improved revenues from cash equity trading, fixed income and commodities trading and clearing and trade management services. However, lower equity derivative trading and clearing revenues limited the upside.
Revenues at Corporate Services increased 1.8% year over year to $170 million. This was mainly owing to a rise in Corporate Solutions revenues and Listings Services revenues.
Information Services revenues rose 15.6% year over year to $156 million. Higher revenues at Data Products as well as Index Licensing and Services drove the upside.
Revenues at Market Technology improved 13% year over year to $87 million on higher change request revenues and software as a service revenues besides a favorable impact from changes in foreign exchange rates. Market Technology order intake totaled $115 million.
Full-Year Highlights
Operating earnings came in at $4.06 per share, missing the Zacks Consensus Estimate of $4.19. Earnings however, improved 10% over 2016.
Top line of $2.428 billion increased 7% over 2016. Revenues were in line with the Zacks Consensus Estimate.
The Nasdaq Stock Market witnessed 268 new listings in 2017, of which, 136 were IPOs.
Financial Update
Nasdaq had cash and cash equivalents of $337 million as of Dec 31, 2017, down 6.5% from 2016-end level. As of Dec 31, 2017, debt increased 19.7% over 2016-end level to $3.83 billion.
Dividend and Share Repurchase Update
The board of directors approved a quarterly dividend of 38 cents per share, payable on Mar 30 to shareholders of record on Mar 16.
During 2017, the company bought back shares worth $203 million. As of Dec 31, 2017, the company had $226 million shares remaining under its repurchase authorization. Subsequently, in January 2018, Nasdaq’s board members announced another $500 million buyback program, taking the tally to $726 million.
Our Take
Nasdaq’s results reflect a solid performance. Growth looks encouraging as the company remains focused on expansion through acquisitions and organic initiatives that enable entry and open up cross-selling opportunities into new markets. The top line should also benefit from the company’s consistent focus on its strategy to accelerate non-transaction revenue base including technology, listing and information revenues.
Zacks Rank
Nasdaq carries a Zacks Rank #2 (Buy). You can see the complete list of today’s Zacks #1 Rank (Strong Buy) stocks here.
Performance of Other Companies From the Finance Sector
Among other players from the finance sector that have reported third-quarter earnings so far, the bottom line of American Express Company (NYSE:AXP) , The Travelers Companies, Inc. (NYSE:TRV) and Discover Financial Services (NYSE:DFS) beat the respective Zacks Consensus Estimate.
The Hottest Tech Mega-Trend of All
Last year, it generated $8 billion in global revenues. By 2020, it's predicted to blast through the roof to $47 billion. Famed investor Mark Cuban says it will produce "the world's first trillionaires," but that should still leave plenty of money for regular investors who make the right trades early.
See Zacks' 3 Best Stocks to Play This Trend >>
Discover Financial Services (DFS): Free Stock Analysis Report
American Express Company (AXP): Free Stock Analysis Report
The Travelers Companies, Inc. (TRV): Free Stock Analysis Report
Nasdaq, Inc. (NDAQ): Free Stock Analysis Report
Original post
Zacks Investment Research