Nasdaq 100:
2237.87
Short-Term Trend: sideways
Outlook:
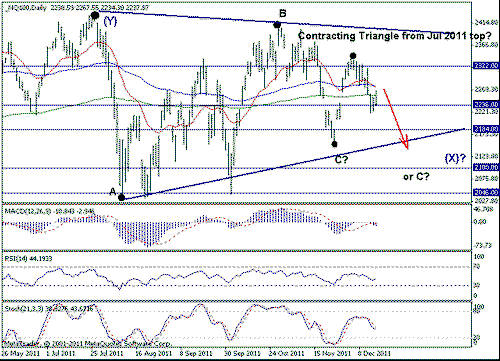
The daily chart remains dead neutral as the prices remain between the most recent extremes (2400 on the upside, and 2150 on the downside). The most logical choice for the wave structure is shown on the chart above. I think a Contracting Triangle since the July 2011 top has been under way. The hourly chart shows the recent sell-off is not complete, so further weakness twd 2184 and possibly twd 2100 is expected. Then, another move higher will be seen if our interpretation is correct.
Strategy: Stand aside.
S&P500:
S&P500: 1219.79
Short-Term Trend: sideways
Outlook:
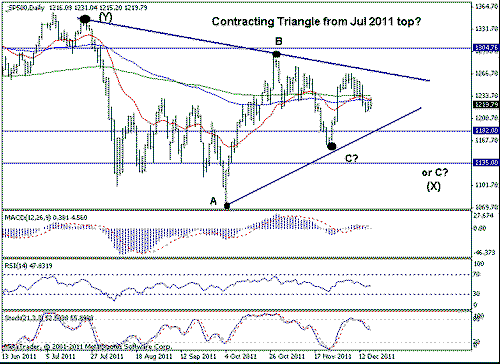
The price structure from the July 2011 top tells me a Contracting Triangle or a Diametric formation has been forming. If the market finds support abv the 1160 level in the next few weeks and then moves higher, then the most recent decline has been wave E of the Triangle that we follow. If a move below 1160 is seen, that will indicate that the market is still in wave C of that triangle. In this case, a decline twd 1135 will be seen, but the October low should remain intact. Overall, we may have a good buying opportunity in the next few weeks, but we are not there yet in my opinion.
Strategy: Stand aside.
