Investing.com’s stocks of the week
Seems like I don’t hear about municipal bonds much anymore. But they have been performing quite well. Their prices cratered going into the 2016 election but almost immediately reversed that trend. Since the election, muni-bond ETF MUB is up 4.7%, after giving back some gains since the beginning of September, likely related to the hurricane damage this fall.
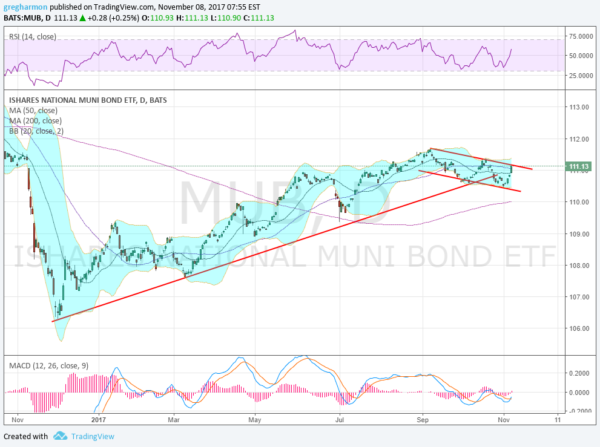
The chart below, though, gives rise to the question of whether the recent pullback is just the ETF catching its breath – or a change of character for municipal bonds. It shows the rise off the November 2016 low, crossing back above its 200-day SMA in May and continuing. That found rising trend support as it continued higher through to October. But then price broke below that support. It did not stay there long and moved back above it Tuesday.
Looking at the most recent price history, MUB has displayed a falling channel since the beginning of September. And Tuesday’s price move took it to the top of that channel. Two conflicting directions. Which takes control? Continuation higher through the rest of the week would indicate the pullback was nothing more than digestion of a long move higher and possibly another leg to come. Rejection at the top of the channel and a return under long-term trend support would suggest a change of trend.
Time to pay closer attention.

