MSCI World Indices Weakening

Published 08/20/2019, 12:21 AM
Updated 07/09/2023, 06:31 AM
US10YT=X
-
MIWO00000PUS
-
MIWOU0000PUS
-

The following daily chart of the MSCI World (ex-USA) Index shows that price has dropped, once again, to just above the 1800 level (as of last Friday's close).

The MACD histogram and RSI indicators are hinting that price is attempting to stabilize on this short-term timeframe and may reverse its decline that began in early July.
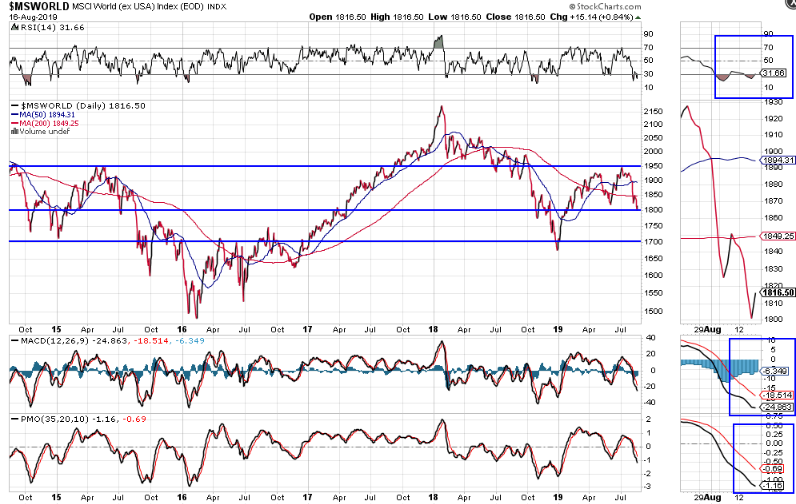
MSCI WORLD Daily Chart

The following monthly chart of the MSCI World, Global (incl USA) Indexes shows that price is stuck at a triple-top formation, after failing to break out and hold above an all-time high set in January 2018.

The RSI, MOM and ROC indicators have yet to make a new swing high above those also set in January 2018.
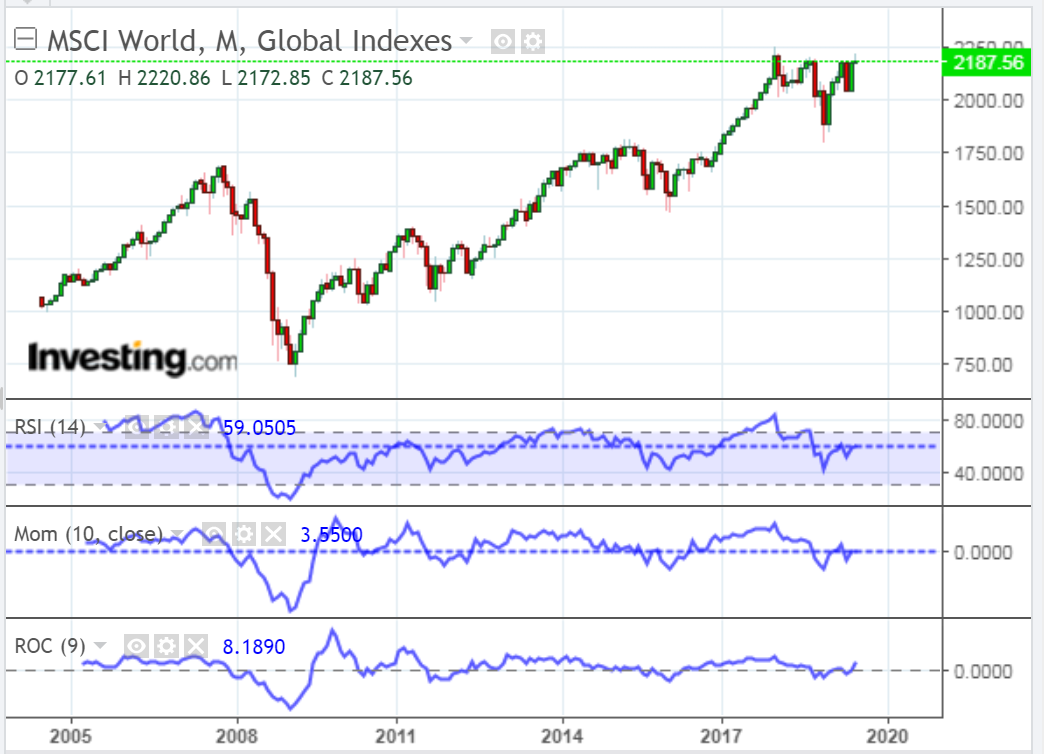
MSCI World Monthly Chart

In summary, keep an eye on:

  • both of these indices and short and longer term timeframes, along with their indicators, as well as
  • U.S. 10-Year Treasury yields and ROC and ATR indicators, as outlined in my post of August 16
  • for clues that World Market Weakness And Negative Yielding Debt may, finally, be paying attention to negative effects of negative bond yields and then weakening further as a result.

    In this regard, this Zero Hedge article outlines why negative rates do not bode well for world economies, markets and more...
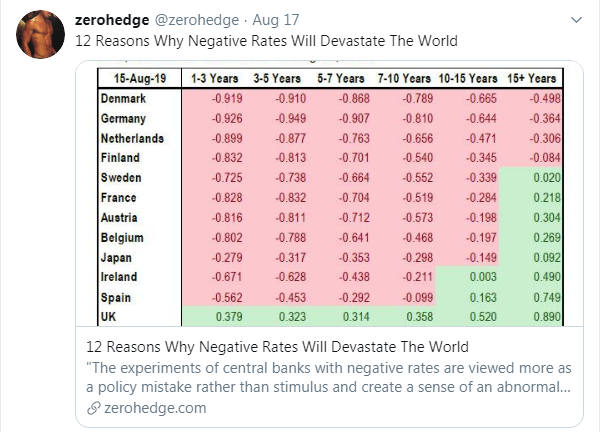
    Why Negative Rates Will Devaste The World

    Latest comments

    Loading next article…
    Risk Disclosure: Trading in financial instruments and/or cryptocurrencies involves high risks including the risk of losing some, or all, of your investment amount, and may not be suitable for all investors. Prices of cryptocurrencies are extremely volatile and may be affected by external factors such as financial, regulatory or political events. Trading on margin increases the financial risks.
    Before deciding to trade in financial instrument or cryptocurrencies you should be fully informed of the risks and costs associated with trading the financial markets, carefully consider your investment objectives, level of experience, and risk appetite, and seek professional advice where needed.
    Fusion Media would like to remind you that the data contained in this website is not necessarily real-time nor accurate. The data and prices on the website are not necessarily provided by any market or exchange, but may be provided by market makers, and so prices may not be accurate and may differ from the actual price at any given market, meaning prices are indicative and not appropriate for trading purposes. Fusion Media and any provider of the data contained in this website will not accept liability for any loss or damage as a result of your trading, or your reliance on the information contained within this website.
    It is prohibited to use, store, reproduce, display, modify, transmit or distribute the data contained in this website without the explicit prior written permission of Fusion Media and/or the data provider. All intellectual property rights are reserved by the providers and/or the exchange providing the data contained in this website.
    Fusion Media may be compensated by the advertisers that appear on the website, based on your interaction with the advertisements or advertisers.
    © 2007-2025 - Fusion Media Limited. All Rights Reserved.