You may thinkthat this is April 2015, and for those who follow the calendar that is exactly correct. A month ago I couldn’t let Fluffy out at night without exposing the little girl to frostbite. Today the grass is green, trees are budding leaves and the wild flowers will be blooming soon. However with America’s perpetual-election cycle, politically it seems to always be either winter, or winter is just around the corner.
Geeze Louise, the next election is in November 2016, and for the next eighteen months we’ll be subjected to continual coverage of presidential candidates who will be promising this, that or the other thing as they have for decades. Economically speaking, today whatever should be going up is going down, and whatever should be going down is going up. No one running for office or reporting on the candidates has a clue what the real problem is. Instead the main-stream media for the next year and a half will be dwelling on whether Hillary has finally connected with the middle class and working poor, or how the Republicans are planning their next attack on women or other minorities.
Sewn into whatever fabric of “reality” the media chooses to weave between their viewers and the candidates will be the question of how these presidential hopefuls plan to make the economy grow. The Republicans will promise to cut taxes and shrink the size of government,not that they mean it. But you can be sure that when a Democrat promises to tax the rich and grow government they will do it given half a chance. Absent from the debate will be the actual reason why the economy and middle-class are doing so poorly: in 2015 Americans and the economy are carrying far more debt than they can reasonably service. The solution to this problem has always been to let Mr Bear and his clean up crews go to work scrubbing the nation’s balance sheets clean of all illiquid and mispriced assets.
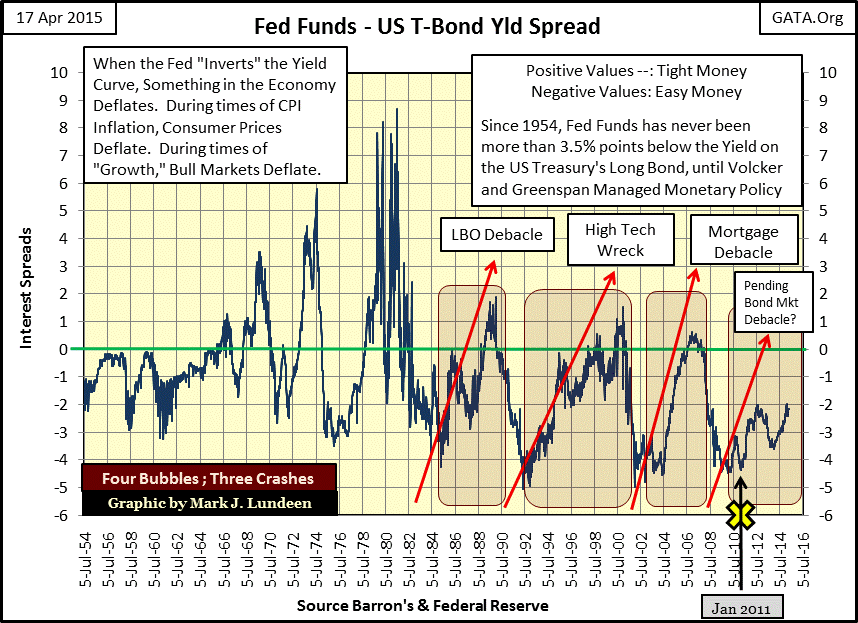
“Market experts” and “economists” would immediately point out that this plan risks national bankruptcy, to which I would respond that today we are decades past the point of bankruptcy, thanks to the cheap-money, low-interest rate cures the academic quacks making “policy” have been subjecting the economy to since the Leveraged Buyout (LBO) debacle of the late 1980s. Our problem is clear as day; not since the early 1980s has the FOMC tightened “monetary policy” with the intent of fully deflating a previous bubble they had inflated, ridding the financial system of its toxic waste.
Today in 2015, Mr Bear has to haul out the excesses of four bubbles in the financial system seen in the chart below. Doing what needs to be done will be painful to the extreme, but if the “policy makers” would for once step aside and let Mr Bear do his job (mark all assets to market {at whatever price they clear} and dispose of the trash), at the end of the process prosperity and employment opportunity would return, and twenty year olds will finally be able move out of their parents’ basement, that is if Mom and Dad manage to hold on to their home through the bear market to come.
Raising the Fed Funds rate 3% above the US Treasury’s long bond yield, and keeping it there for a year with a sincere and much publicized no more bailouts policy for the banks would be sufficient to begin the process that would last a few election cycles. However, proposing such a policy is not how one wins high political office.
So much for Mr Bear’s bid for high office; now let’s take a look at the NYSE 52Wk Highs- 52Wk Lows Ratio. Each day I take the net of the NYSE’s 52Wk Highs –Lows and divide it into the total number of issues trading that day to arrive at the ratio. Below we see the ratio from the summer of 2009 to present. Notice how the ratio has lost steam over time. Back in 2010 it routinely rose above 15%. The ratio reached 15% once in September of 2012, and a few more times in late spring 2013, but since then it’s been struggling to rise above the 10% line, something it hasn’t managed to do since June of 2014.
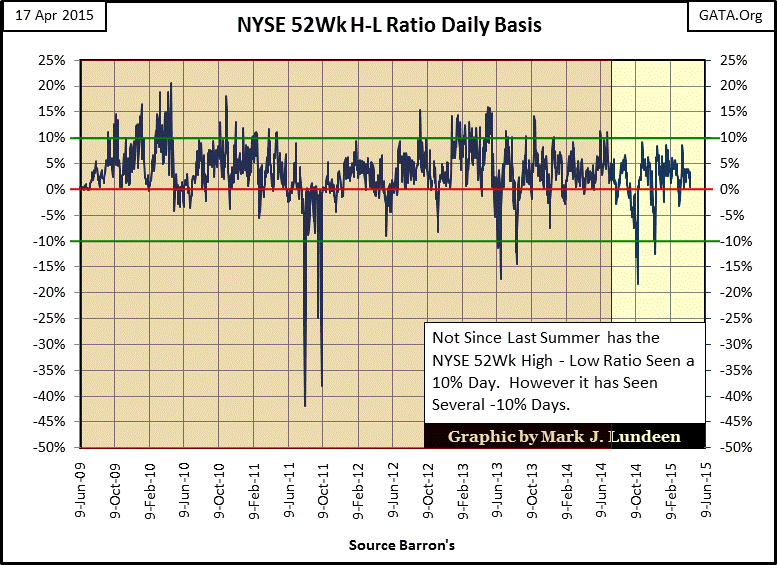
What the NYSE 52Wk H-L Ratio can still manage to do is descend below 10%;in facton October 15th of last year it fell to negative 18.25% on a Dow Jones decline of only 6.59%. The Dow Jones may be only 2.53% below its last all-time high of last month, but I suspect most stocks aren’t doing quite that well.
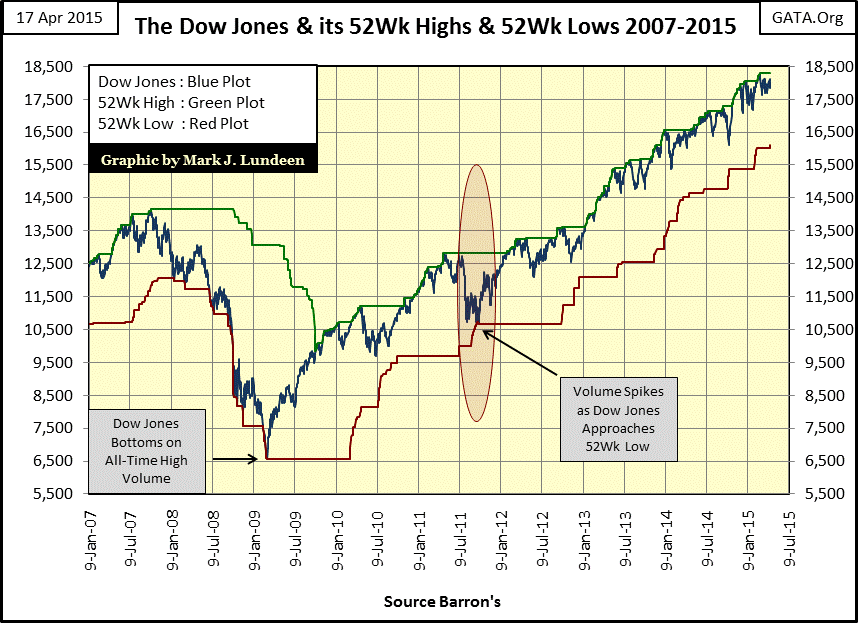
Here we see the Dow Jones 30 with its 52Wk high (Green Plot) and 52Wk low (Red Plot). The last time the Dow Jones came within a hair of making a new 52Wk Low (Red Oval) occurred in September-October 2011. We can see what happened to the NYSE 52Wk H-L Ratio above when this occurred, but the Dow Jones is currently hugging its 52Wk High Line, if not making new 52Wk highs.
Take a moment to study the blue Dow Jones plot with its green 52Wk High line; since January 2013 the Dow Jones has been pushing its 52Wk High line with an intensity missing before. I wouldn’t rule out seeing the Dow Jones at new all-time highs in the months to come. At Friday’s close it was only 2.53% from its last all-time high, but with a two year run seen below one has to ask how much longer this can continue?
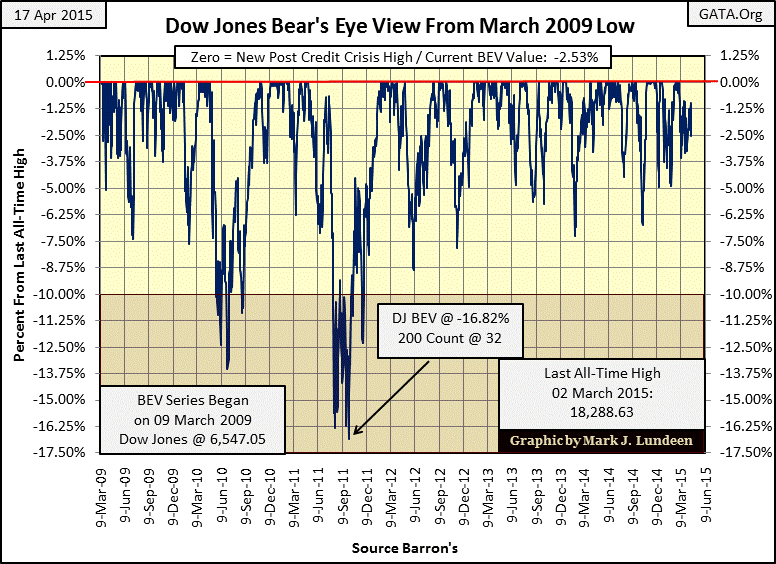
Below is the Dow Jones BEV plot. After today’s “big drop” of 279 points it finds itself only 2.53% from its last all-time high. After all the price inflation in the Dow Jones since March 2009, 279 points represent only about a 1.5% decline. Things neverreally get interesting until we see the Dow Jones beginning a series of 2% or greater days, of which there have been only two since February 2014. I don’t like this market, but as of today it appears that the “policy makers” have been successful in enforcing “stability” on the stock market.
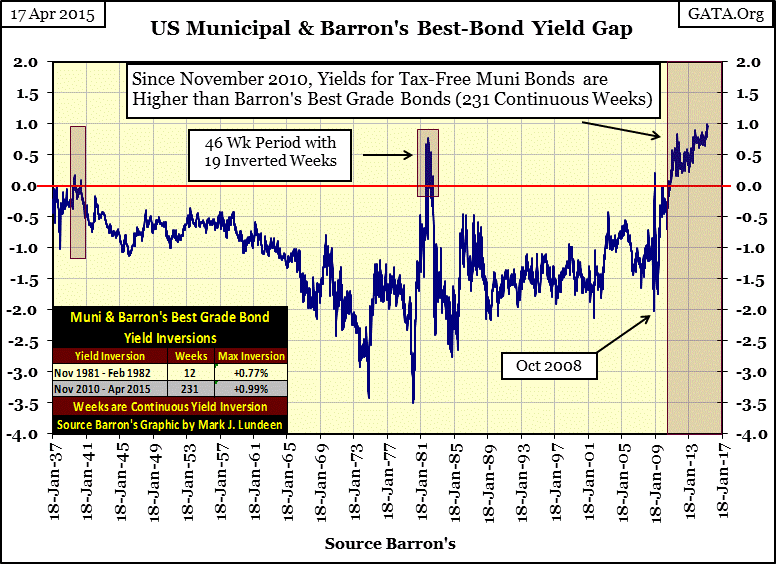
But I dosee someclouds on the horizon. Much has been made recently over Greece’s debt problems, but one needn’t travel that far to find stress cracks growing in the fixed income market;muni bonds are now yielding almost1% more than Barron’s Best Grade Bonds! Two weeks ago they were yielding 0.99% more than Barron’s Best Bonds, that’s HUGE.
Muni bonds are issued by cities and states and are a source of tax free income to wealthy individuals. In a world hungry for income, why are millionaires avoiding these bonds? Simply because local and state politicians have been overly generous with their union employees’ pay and benefits, and now many, if not most local governments are near the point of insolvency.
Municipal bonds,like allbonds in 2015, have large derivative positions riding on them. The consequences of a bond debacle anywhere in the worldwouldspread far and wide. The bull market in financial assets that began in the early 1980s could very well come to an end in 2015, providing the rocket fuel necessary to launch gold and silver into the stratosphere as trillions of dollars flee counter party risk. I’ll tell you a little secret: Mr Bear is the biggest precious metals bull there is.
