🥇 First rule of investing? Know when to save! Up to 55% off InvestingPro before BLACK FRIDAYCLAIM SALE

Moving Averages Suggest Bitcoin Is Bottoming, Analysts Claim

Published 10/09/2019, 02:33 PM
Updated 07/14/2021, 10:35 AM
BTC/USD
-
BTC/USD
-

Until now, there have been three major Bitcoin corrections. They began in June 2011, November 2013, and December 2017. Numerous cryptocurrency traders use these as references for future price movements.

There have been several similarities between the 2014 correction and the current one — leading many people to believe that the absolute low has been reached at $3200 in December 2018.

Cryptocurrency analyst @davthewave claims that the current correction has been weaker than 2014 one. He did so by noting the difference in the movement in the yearly MAs — most notably, the one, two and three-year moving averages.
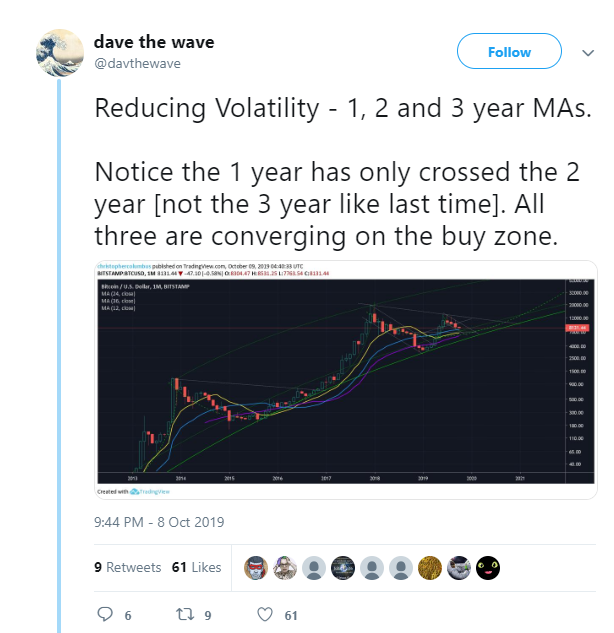
Crypto Analyst On BTC MAs
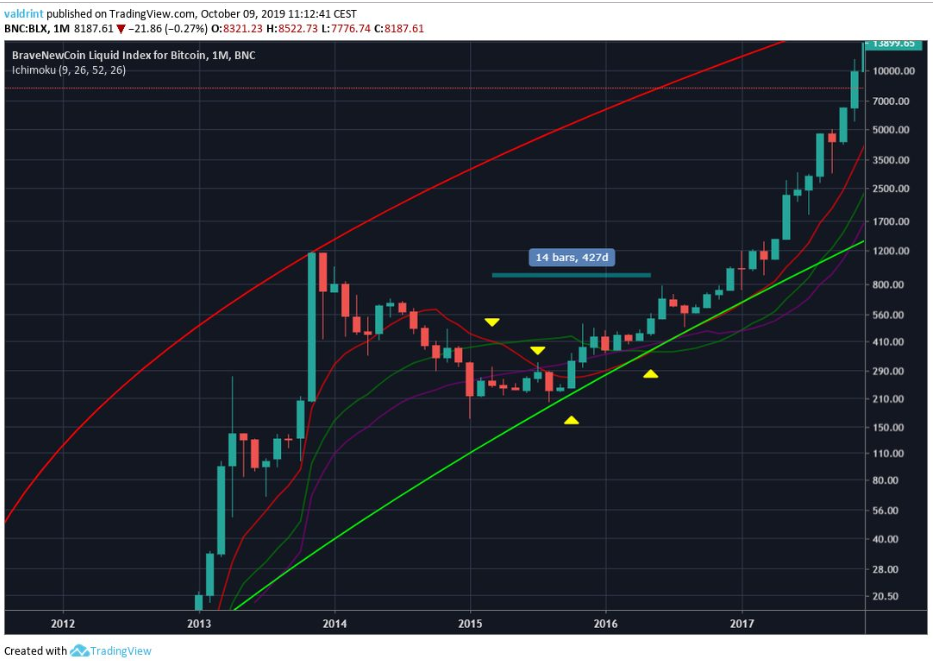
2014's BTC Correction
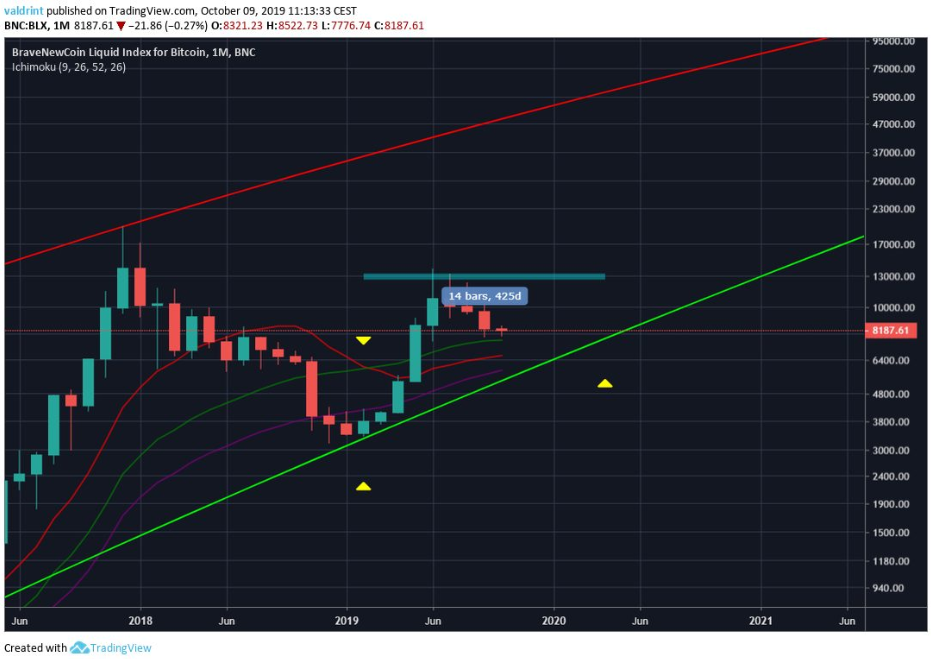
BTC's 2018 Correction

Moving Average Similarities

A number of indicators and methods can be used to compare movements — one of the most common being moving averages (MA). The relationship between them and price can be crucial in determining the direction and the strength of the underlying trend.Looking at the 2014 correction, the price and MA movements went as follows:

  • A bearish cross between the 1- and 2-year MAs transpired in March 2015. The price was trading below all three MAs at the current time.
  • Afterward, a bearish cross between the 1- and 3-year MAs followed in July 2015 — right before the price touched the support line.
  • Afterward, the Bitcoin price swiftly moved above the MAs and used them as support. Until the current correction, the price did not trade below the MAs or the support line. A bullish cross between the aforementioned MAs transpired in May 2016.

It took 427 days for the Bitcoin price to recover from the bearish cross and make a bullish one.On the other hand, the movement in the 2018 correction has been different. A bearish cross between the 1- and 2-year MAs occurred in February 2019. At this time, the price had already reached the support line. It immediately began to move upward and crossed above both MAs.Unlike the previous correction, a bearish cross between the 1- and 3-year MAs has yet to occur and, based on the current price movement, looks unlikely. This is since the Bitcoin price is already trading above all three MAs — which have begun to turn upwards.Giving a similar amount of time for a bullish cross to occur as the previous correction, it should happen in April 2020. However, the correction has been weaker and we may expect a bullish cross and full price recovery sooner.

RSI Similarities

Another similarity that can help us predict when that bullish cross will occur is given by the RSI.

It reached identical values of 43 in January 2015 and 2019.
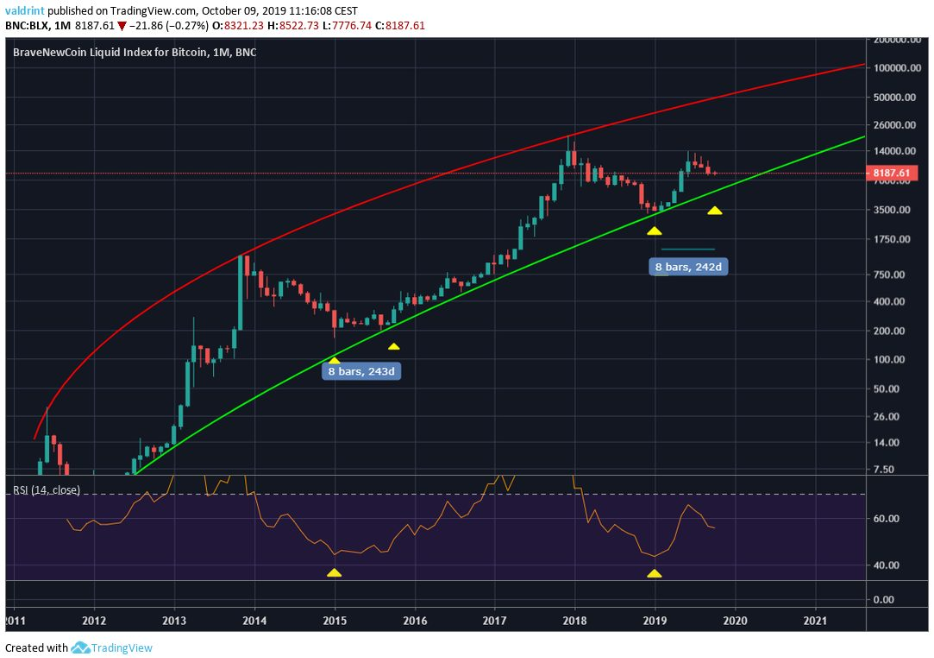
BTC's RSI In January 2015 And 2019

After January 2015, it reached a higher low in October 2015 before moving upward and creating a bullish cross.

If the movement after January 2019 takes the same amount of time, the price should make a higher low this month — reaching the support line and moving upward and creating a bullish cross. This fits with the hypothesis laid out in the previous section and our long-term analysis.

Do you think we have finished the current Bitcoin price correction? If not, where will the price make a low? Let us know your thoughts in the comments below.

Latest comments

Loading next article…
Risk Disclosure: Trading in financial instruments and/or cryptocurrencies involves high risks including the risk of losing some, or all, of your investment amount, and may not be suitable for all investors. Prices of cryptocurrencies are extremely volatile and may be affected by external factors such as financial, regulatory or political events. Trading on margin increases the financial risks.
Before deciding to trade in financial instrument or cryptocurrencies you should be fully informed of the risks and costs associated with trading the financial markets, carefully consider your investment objectives, level of experience, and risk appetite, and seek professional advice where needed.
Fusion Media would like to remind you that the data contained in this website is not necessarily real-time nor accurate. The data and prices on the website are not necessarily provided by any market or exchange, but may be provided by market makers, and so prices may not be accurate and may differ from the actual price at any given market, meaning prices are indicative and not appropriate for trading purposes. Fusion Media and any provider of the data contained in this website will not accept liability for any loss or damage as a result of your trading, or your reliance on the information contained within this website.
It is prohibited to use, store, reproduce, display, modify, transmit or distribute the data contained in this website without the explicit prior written permission of Fusion Media and/or the data provider. All intellectual property rights are reserved by the providers and/or the exchange providing the data contained in this website.
Fusion Media may be compensated by the advertisers that appear on the website, based on your interaction with the advertisements or advertisers.
© 2007-2024 - Fusion Media Limited. All Rights Reserved.