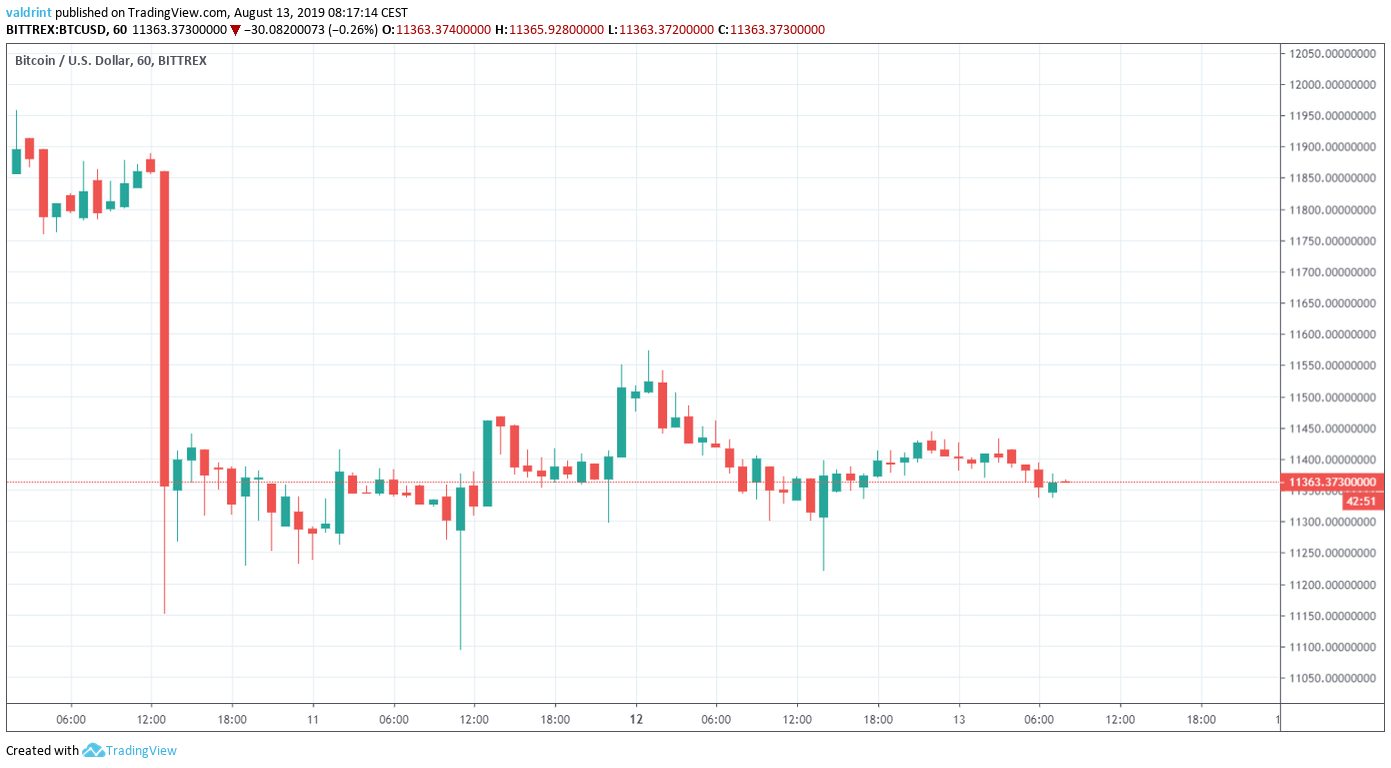
On August 10, 2019, the Bitcoin price reached a high of $11,958. A rapid decrease occurred during the same day. BTC reached lows of $11,151. Since then, it has been gradually increasing without much fluctuation — briefly reaching values close to $11,600.
Will volatility return to BTC? Keep reading if you are interested in finding out.
Bitcoin Price: Trends and Highlights for August 13
Short-Term BTC Price Support
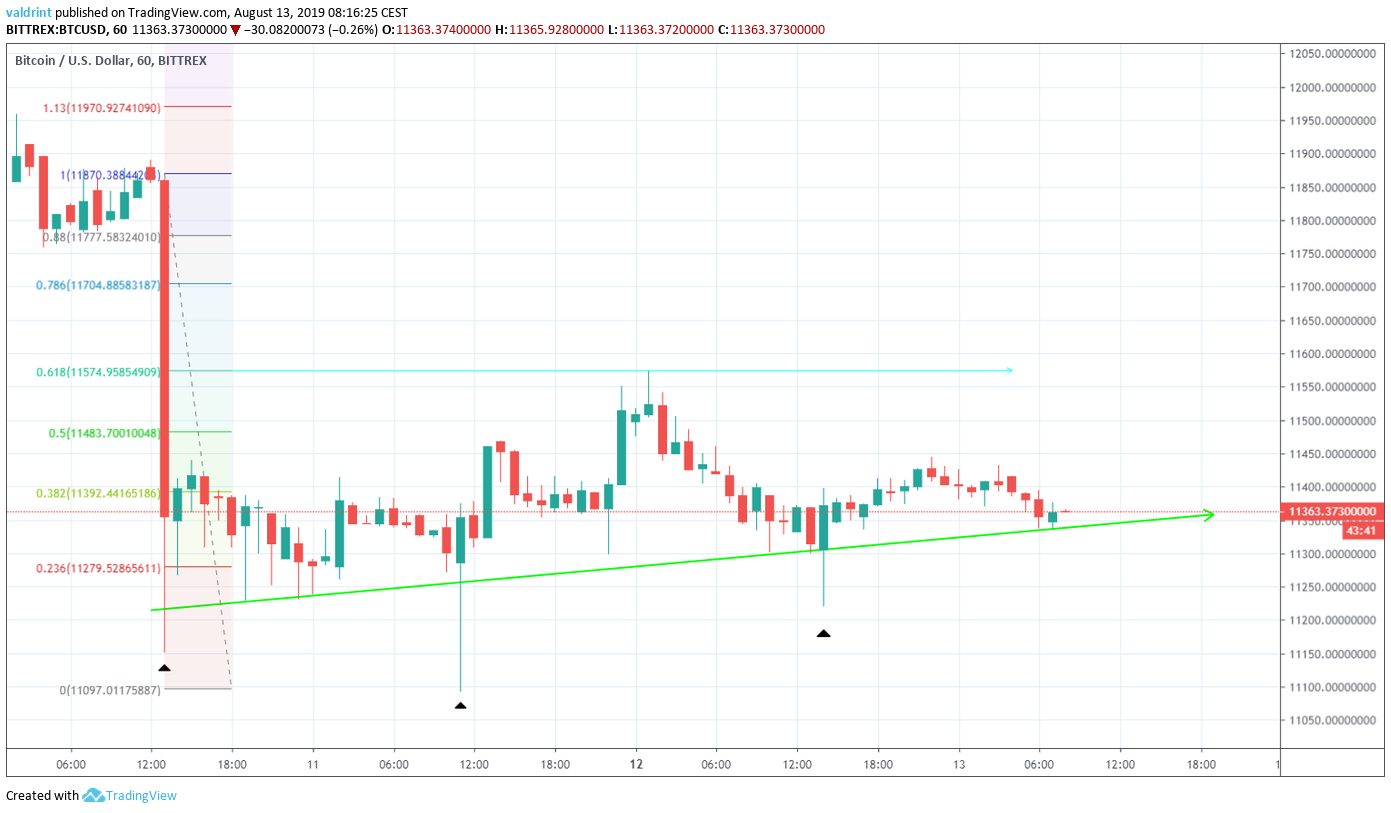
A closer look at the hourly time-frame reveals that since the crash, the BTC price has been following an ascending support line.
First, we can see by the long lower wicks that there is significant buying pressure below $11,300.
The Bitcoin price retracement ended once the price reached the 0.618 fib level at $11,600. BTC has not reached similar levels since.
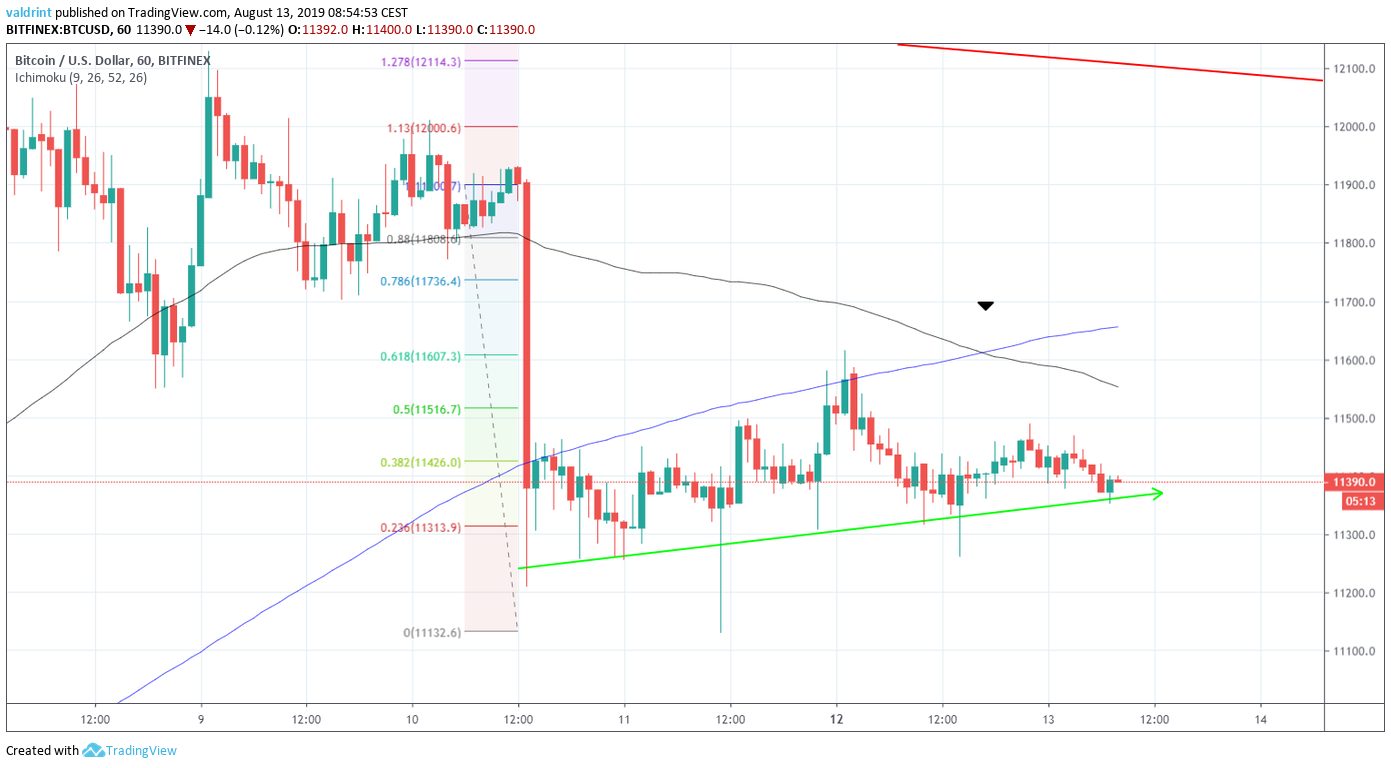
A look at the moving averages (MA) suggests that the price will not reach them in the near future.
A bearish cross between the relatively long-term 100- and 200-hour MAs transpired on August 12.
The Bitcoin price has been trading below both since.
While this makes it likely that BTC will eventually break down from the support line and revisit the $11,200 level, it does not indicate a longer downtrend.
Let’s take a look at a different time-frame to see if that is likely.
Descending Channel
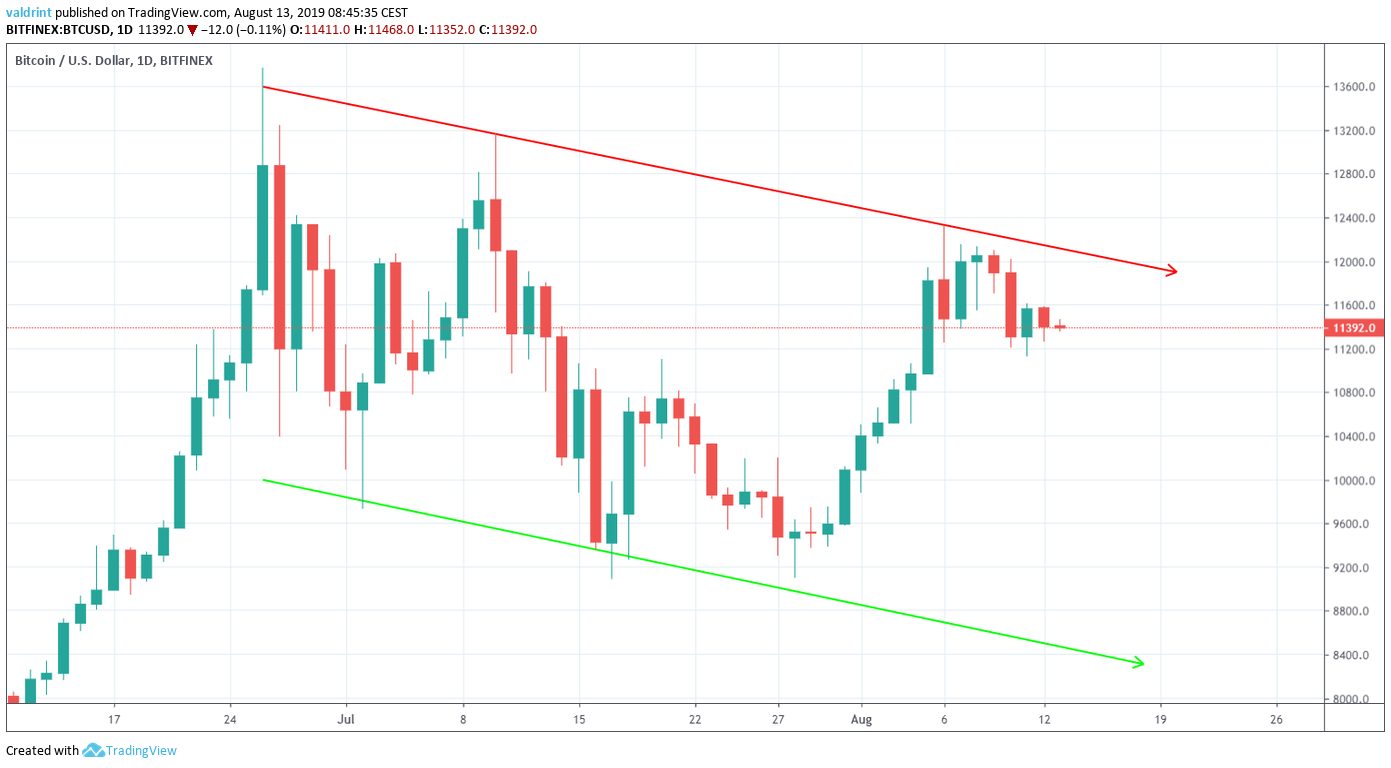
A look at the daily time-frame shows the descending channel that the BTC price has been trading in since June 24.
At the time of writing, BTC was trading very close to the resistance line.
The previous two times it had done so, downward moves towards the support line followed.
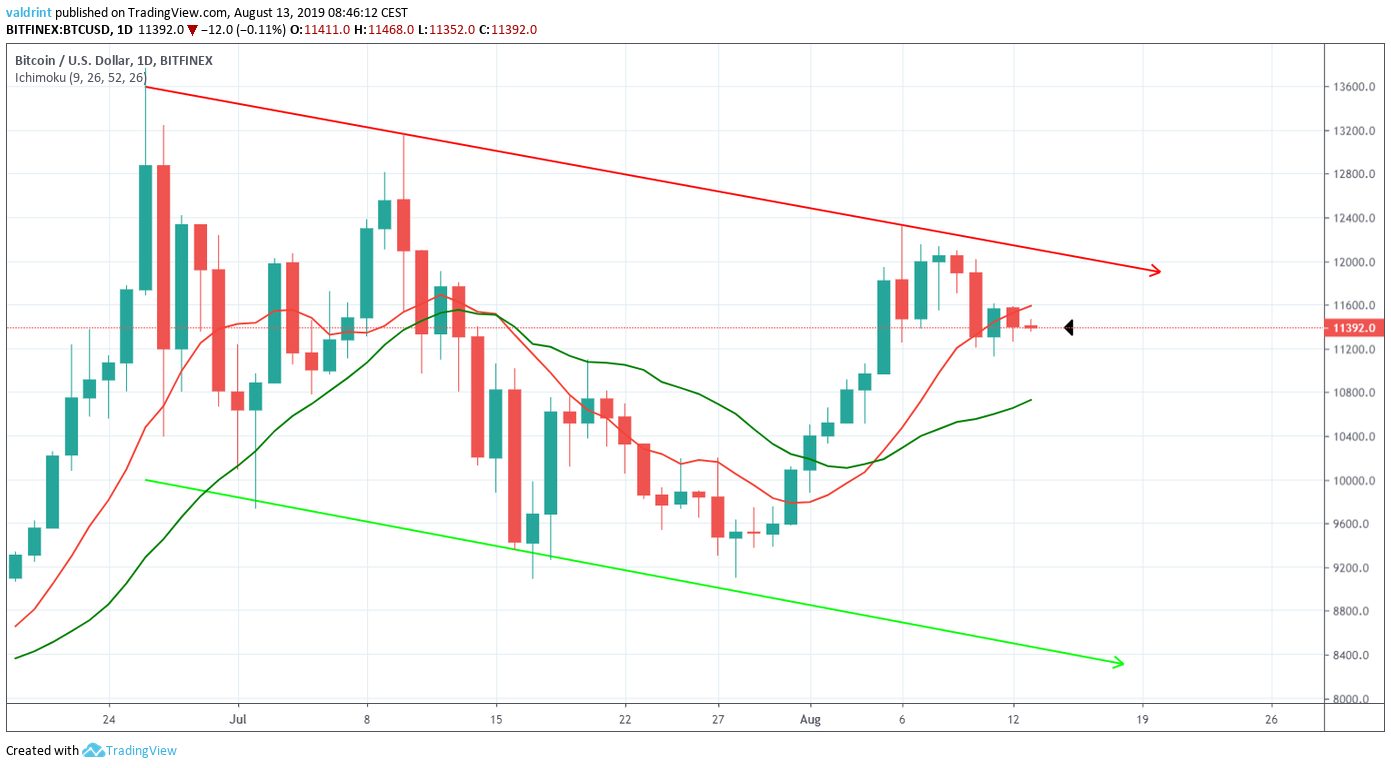
Incorporating moving averages into the analysis suggests that the rate of growth for BTC has slowed considerably.
The price is trading below the 10-day MA, which has begun to potentially turn downwards.
However, a bearish cross has yet to occur, and the BTC price is still trading above the 20-day MA.
An important level to keep an eye on is the support area at $10,900 which is outlined below:
The area also marked the creation of a bullish engulfing candle on August 5.
A daily price close below it could trigger a rapid decrease towards the support line of the channel.
However, a decrease of such magnitude for a short period of time currently seems unlikely.
Bitcoin Price Summary
After suffering a flash crash on August 10, BTC has been trading devoid of significant volatility.
According to our analysis, it is likely to continue doing so.
A drop towards $11,200 is likely, and one towards $11,000 possible.
We do not believe the price is likely to decrease below $11,000.
