This is our fourth and final installment on assessing the relative valuation of utility stocks today. Our first installment part 1 looked at utility stocks in general. In part 2 we covered utilities operating in the Western part of the United States, and in part 3 we looked at utilities operating in the Central states. This final installment, part 4, will review utility stocks located in the Eastern region of the United States.
As we stated in previous installments, the utility sector is experiencing a lot of change. With growth long inhibited by regulators, utilities throughout the country have been looking for ways to diversify their businesses and/or develop new markets. Another change that is sweeping the industry is mergers and acquisitions.
A few examples in the Eastern utility sector include Duke Energy (DUK) and Progress Energy merging, and Central Vermont Public Service Corporation (CV) was acquired by Green Mountain Power (GMP). Although these actions may prove to be successful, they do make analysis more difficult because there is scant history of the combined entities to scrutinize.
Eastern Utility Stocks Historical Overvaluation Is A Concern
The following table looks at the 14 surviving premier publicly-traded Eastern utility companies. A review of this table discloses that virtually every utility company in the Eastern portion of the United States is fundamentally overvalued today. There are a couple companies where you could argue for fair value or maybe full value instead of overvalued. However, as we pointed out in the previous installments of this series on utility stocks, due to their low growth histories, getting valuation correct before investing in a utility is more critical than it is for companies that typically grow faster.
One quick valuation check is to compare the current PE ratio of each utility stock on the below table against their historical normal PE ratio. Virtually every company on the list has a current PE ratio that is at worst higher than its historical norm, and at best equal to historical norms. However, we have continuously cautioned throughout this series on the importance of evaluating utility stocks one at a time over drawing conclusions in general.
Nevertheless, when reviewing the major utility companies in the Eastern portion of the United States, there are no bargains that we could find. There are only four companies with current PE ratios below historical norms (see green highlights on table below): Exelon Corp (EXC), Top of Form
Public Service Enterprise Group (PEG), PPL Corp (PPL) and TECO Energy, Inc (TE).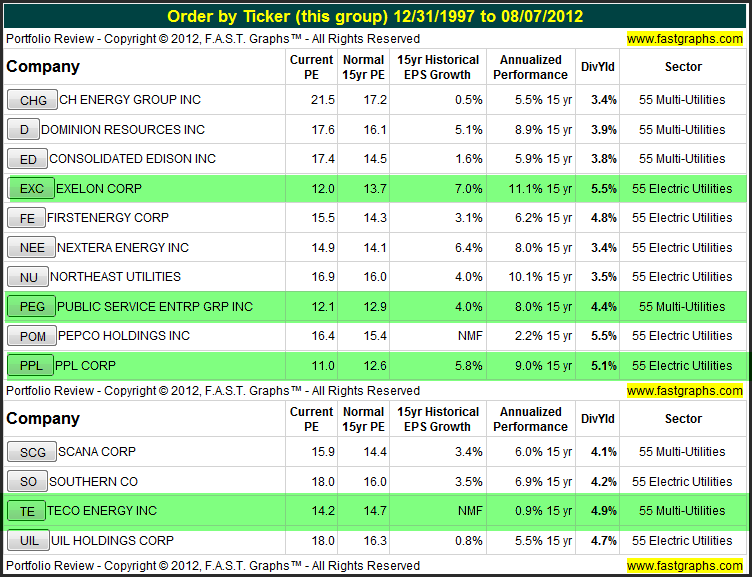
Four Examples With Current PEs Below Historical Normal PEs
A quick review of the four examples of Eastern utility stocks (see green highlights on table) with current PE ratios below their historical norm shows that three of the four are currently experiencing declining earnings. And our fourth example, TECO Energy, is fully valued, although not overvalued.
Exelon Corp (EXC) – Directly from their website
“Exelon Corporation (EXC) is the nation’s leading competitive energy provider, with approximately $33 billion in annual revenues. Headquartered in Chicago, Exelon has operations and business activities in 47 states, the District of Columbia and Canada. Exelon is the largest competitive U.S. power generator, with approximately 35,000 megawatts of owned capacity comprising one of the nation’s cleanest and lowest-cost power generation fleets. The company’s Constellation business unit provides energy products and services to approximately 100,000 business and public sector customers and approximately 1 million residential customers. Exelon’s utilities deliver electricity and natural gas to more than 6.6 million customers in central Maryland (BGE), northern Illinois (ComEd) and southeastern Pennsylvania (PECO).” 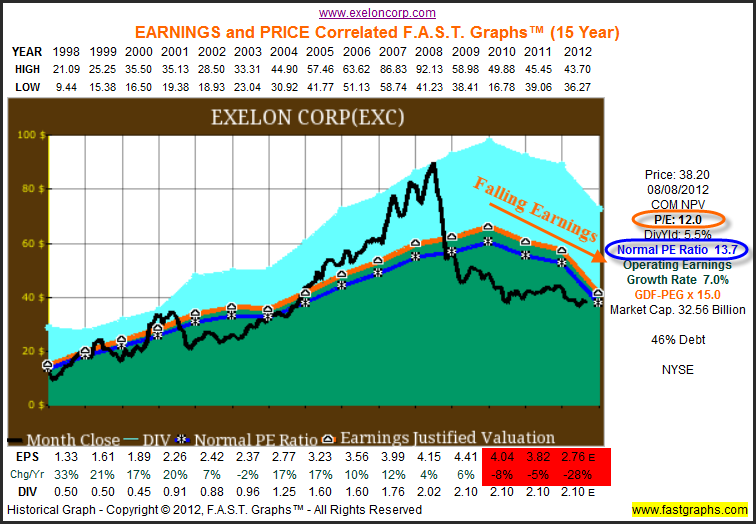
PPL Corp (PPL) – Directly from their website
“PPL Corporation, headquartered in Allentown, Pa., through its affiliated companies, owns or controls about 19,000 megawatts of generating capacity in the United States, sells energy in key U.S. markets, and delivers electricity and natural gas to about 10 million customers in the United States and the United Kingdom. 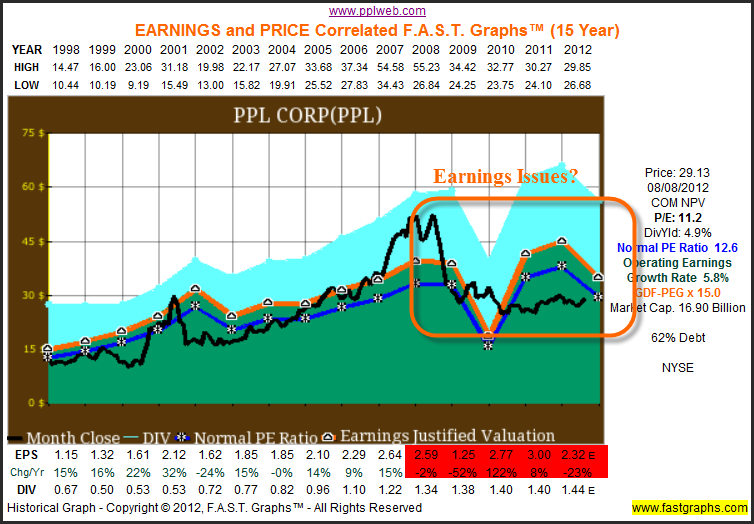
Public Service Enterprise Group, Inc (PEG) – Directly from their website
“Public Service Enterprise Group (PSEG) is a publicly traded (PEG), integrated generation and energy company headquartered in Newark, New Jersey. Its main subsidiaries are: Public Service Electric and Gas Company (PSE&G), PSEG Power LLC, and PSEG Energy Holdings LLC. PSE&G is a regulated New Jersey utility delivering gas and electric safely and reliably to about 70% of New Jersey's population. PSEG Power is a major wholesale energy supplier in the Northeast with three main subsidiaries: PSEG Fossil LLC, PSEG Nuclear LLC, and PSEG Energy Resources & Trade LLC (PSEG ER&T). PSEG Energy Holdings is a company with domestic investments and has two main energy-related businesses: PSEG Global and PSEG Resources.” 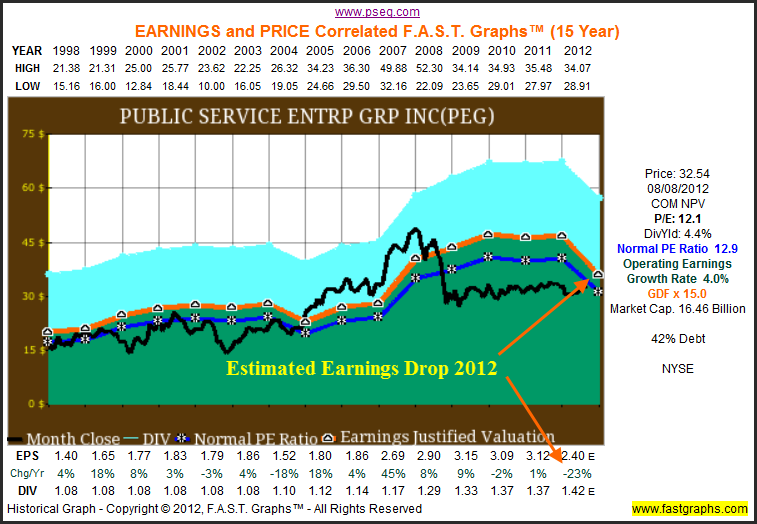
TECO Energy Inc (TE) – Directly from their website
“TECO Energy, Inc. (TE) is an energy-related holding company. Its principal subsidiary, Tampa Electric Company, is a regulated utility in Florida with both electric and gas divisions (Tampa Electric and Peoples Gas System). Other subsidiaries include TECO Coal, which owns and operates coal production facilities in Kentucky and Virginia, and TECO Guatemala, which is engaged in electric power generation and energy-related businesses in Guatemala.” 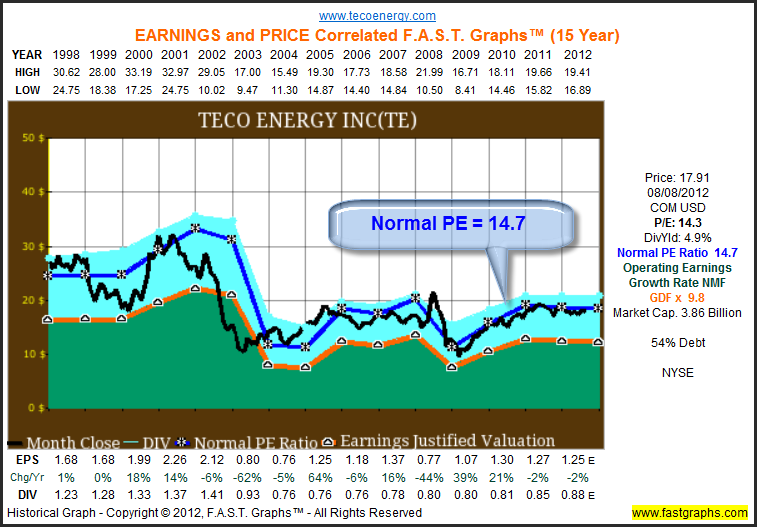
F.A.S.T. Graphs™ - A Pictures Is Worth 1000 Words
For the sake of economy of words, we present the following 15-year historical earnings and price correlated F.A.S.T. Graphs™ on eight well-known Eastern utility stocks. Calculated performance tables follow each of the historical graphs. There are a few key points that the reader should focus on as they review the historical graphs and the performance tables.
First and foremost, the orange earnings justified valuation line represents fair value calculated utilizing widely accepted formulas for valuing a business. The black line is the monthly closing stock price line. The reader should focus on the correlation between earnings (the orange line) and stock price (black line) over time. The questions to be answered are simply whether or not the stock price is tracking the earnings line and what happens when it deviates from it? Focusing on answering these questions validates the undeniable earnings and price relationship.
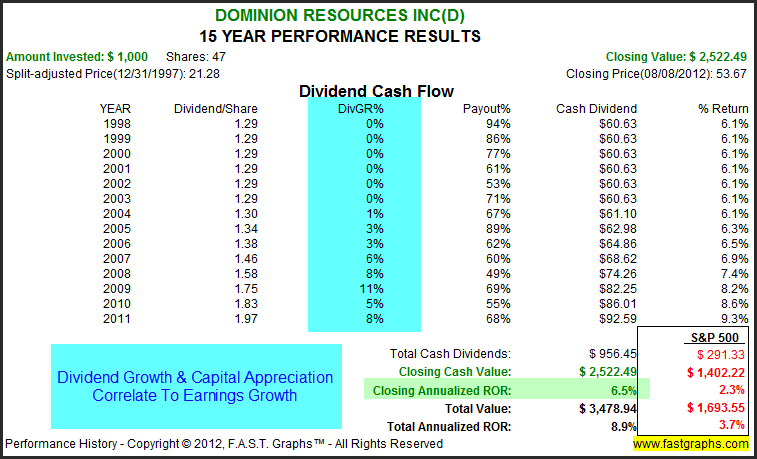
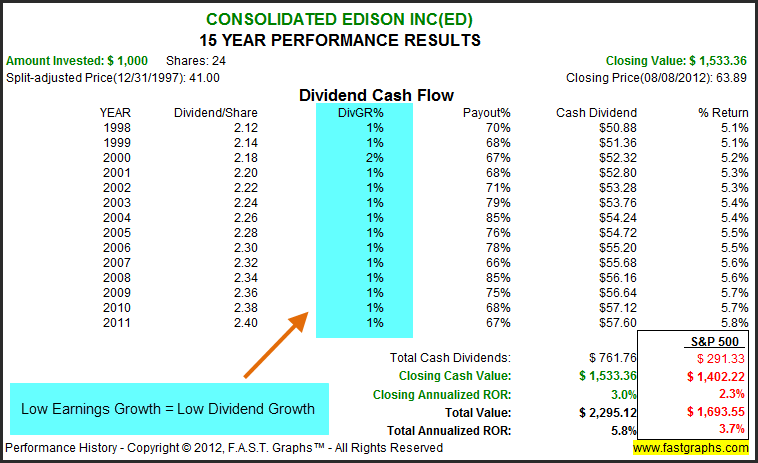
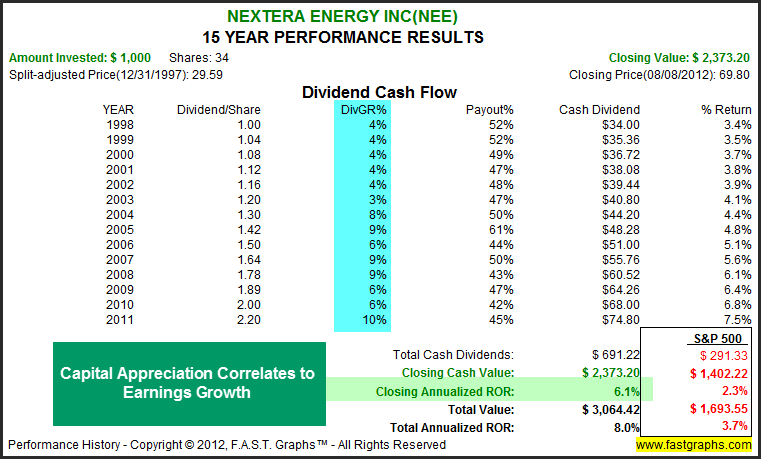
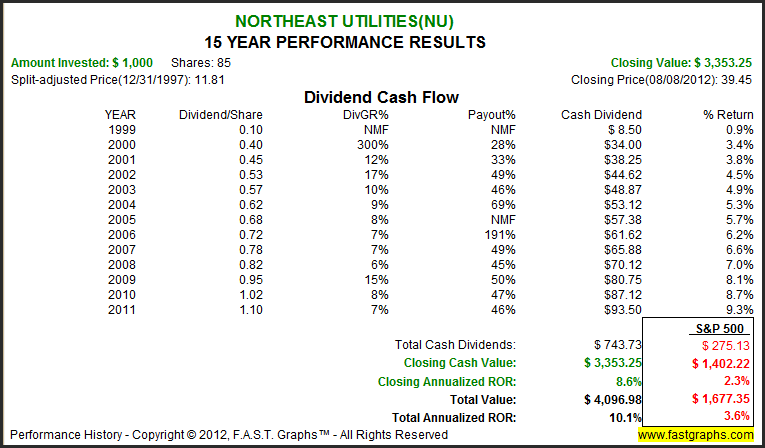
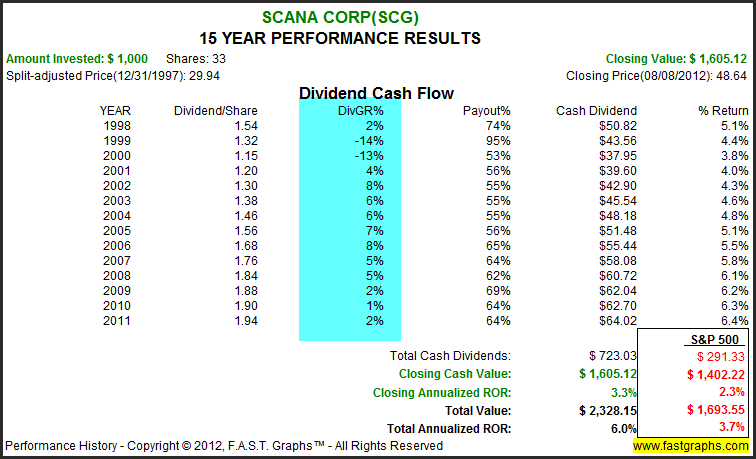
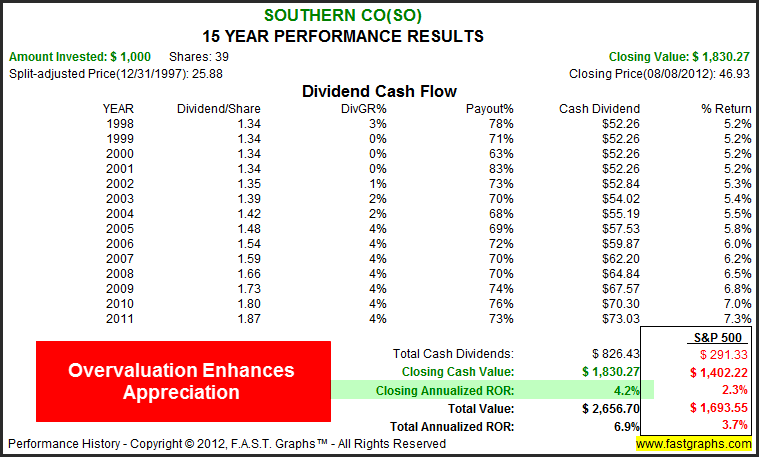
When evaluating the performance tables, notice how capital appreciation (Closing Annualized ROR) closely correlates to the company’s earnings growth rate adjusted by valuation. Also, notice how the dividend growth rate and dividends in general are affected by earnings results. In other words, close examination will reveal how earnings growth drives and determines these two components of return.
We suggest that a careful examination of the following graphs and tables will provide the reader with a clearer perspective of the long-term realities of investing in utilities stocks. Investing in utilities stocks is quite different than investing in the typical dividend growth stock. Utility stocks have their own unique attributes and characteristics and therefore, need to be evaluated accordingly. We hope that this article, and the three that have preceded it, have provided the reader with greater insights into investing in the world of utility stocks.
Dominion Resources Inc (D) – Directly from their website
“Dominion is one of the nation's largest producers and transporters of energy, with a portfolio of approximately 28,200 megawatts of generation, 11,000 miles of natural gas transmission, gathering and storage pipeline and 6,300 miles of electric transmission lines.
Dominion operates the nation's largest natural gas storage system with 947 billion cubic feet of storage capacity and serves retail energy customers in 15 states.” 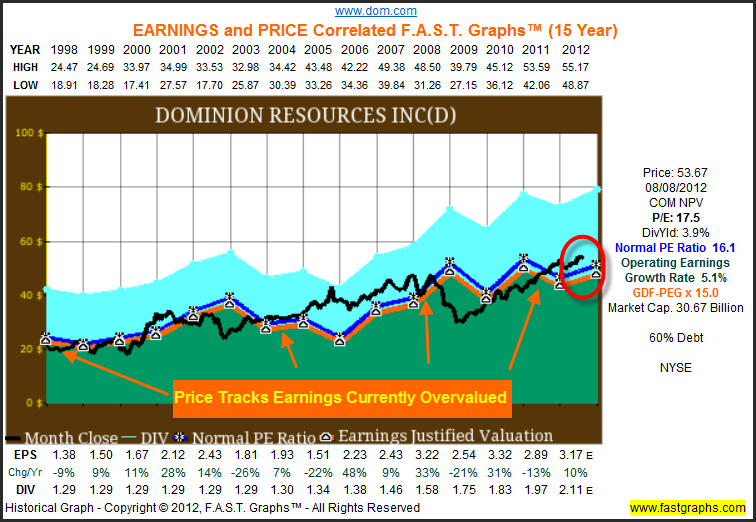
Consolidated Edison Inc (ED) – Directly from their website
“Con Edison is a subsidiary of Consolidated Edison, Inc. (NYSE: ED), one of the nation's largest investor-owned energy companies, with approximately $13 billion in annual revenues and $37 billion in assets. The utility provides electric, gas and steam service to more than three million customers in New York City and Westchester County, New York. For additional financial, operations and customer service information, visit us on the Web at www.conEd.com, at our green site, www.coned.com/thepowerofgreen, or find us on Facebook at Power of Green.”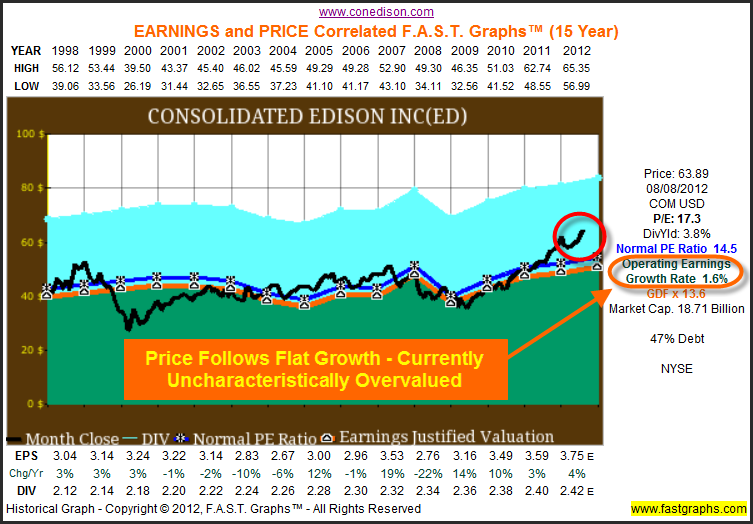
FirstEnergy Corp (FE) – Directly from their website
“FirstEnergy Corp. (NYSE: FE) is a diversified energy company dedicated to safety, reliability and operational excellence. Its 10 electric distribution companies comprise one of the nation's largest investor-owned electric systems. Its diverse generating fleet features non-emitting nuclear, scrubbed baseload coal, natural gas, and pumped-storage hydro and other renewables, and has a total generating capacity of nearly 23,000 megawatts.” 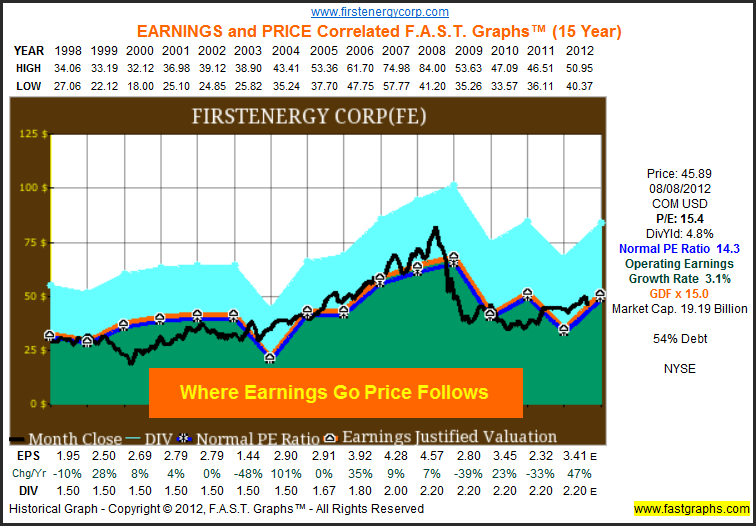
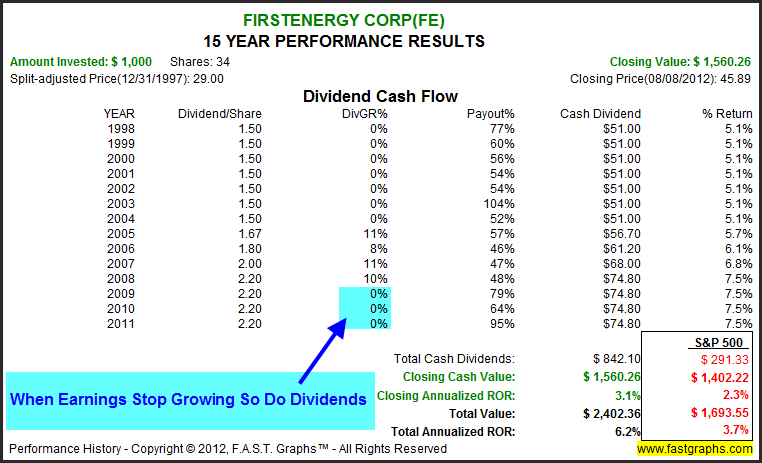
NextEra Energy, Inc (NEE) – Directly from their website
“NextEra Energy, Inc. (NYSE: NEE) is a leading clean energy company with revenues of more than $15.3 billion, more than 41,000 megawatts of generating capacity, and approximately 15,000 employees in 24 states and Canada as of year-end 2011. Headquartered in Juno Beach, Fla., NextEra Energy's principal subsidiaries are Florida Power & Light Company, which serves approximately 4.6 million customer accounts in Florida and is one of the largest rate-regulated electric utilities in the country, and NextEra Energy Resources, LLC, which together with its affiliated entities is the largest generator in the United States of renewable energy from the wind and sun. Through its subsidiaries, NextEra Energy generates clean, emissions-free electricity from eight commercial nuclear power units in Florida, New Hampshire, Iowa and Wisconsin.”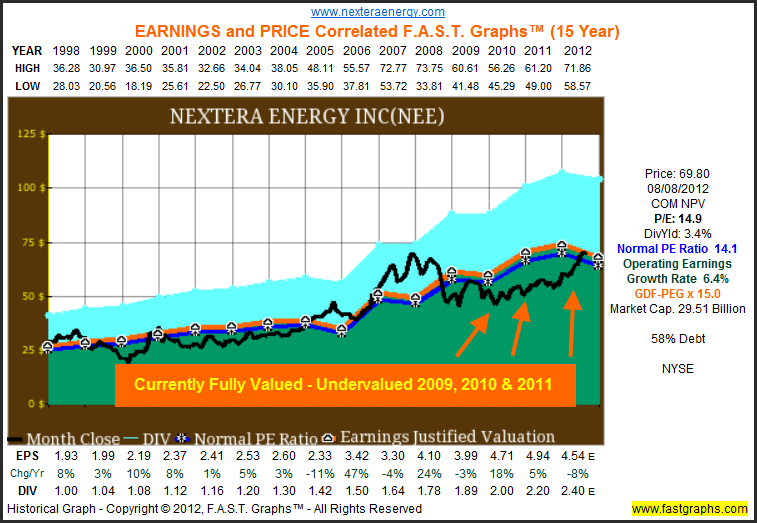
Northeast Utilities (NU) – Directly from their website
“Northeast Utilities operates New England’s largest utility system serving more than 3.5 million electric and natural gas customers in Connecticut, Massachusetts and New Hampshire. NU is dedicated to this region, as well as the people, energy and technology so vital to its security, stability and economic strength.”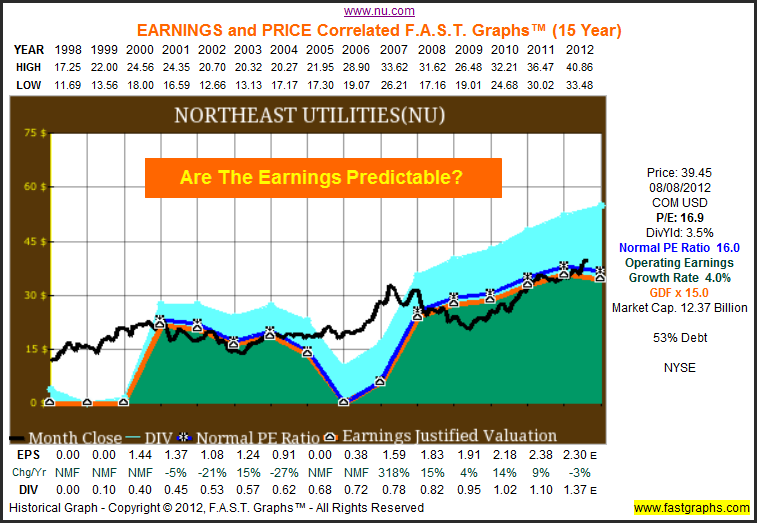
SCANA Corp (SCG) – Directly from their website
“SCANA Corporation, headquartered in Cayce, SC, is an energy-based holding company principally engaged, through subsidiaries, in electric and natural gas utility operations and other energy-related businesses.”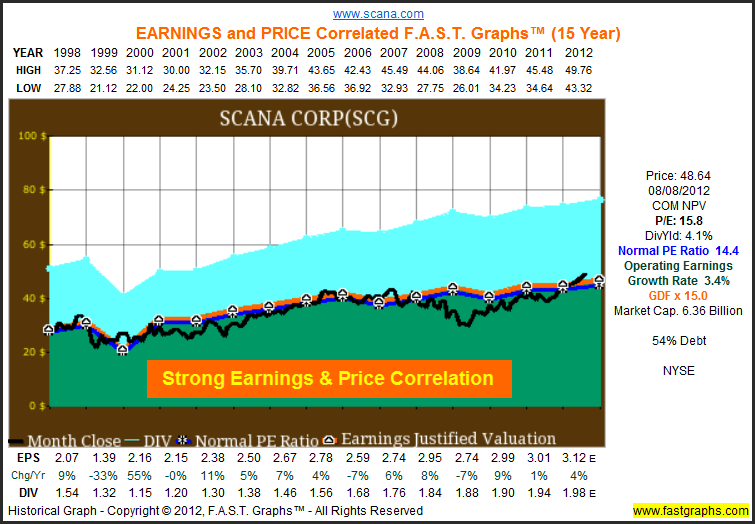
Southern Co (SO) – Directly from their website
“With 4.4 million customers and more than 43,000 megawatts of generating capacity, Atlanta-based Southern Company (NYSE: SO) is the premier energy company serving the Southeast. A leading U.S. producer of electricity, Southern Company owns electric utilities in four states and a growing competitive generation company, as well as fiber optics and wireless communications. Southern Company brands are known for excellent customer service, high reliability and retail electric prices that are below the national average. Southern Company also is continually ranked among the top utilities in Fortune's annual World's Most Admired Electric and Gas Utility rankings.”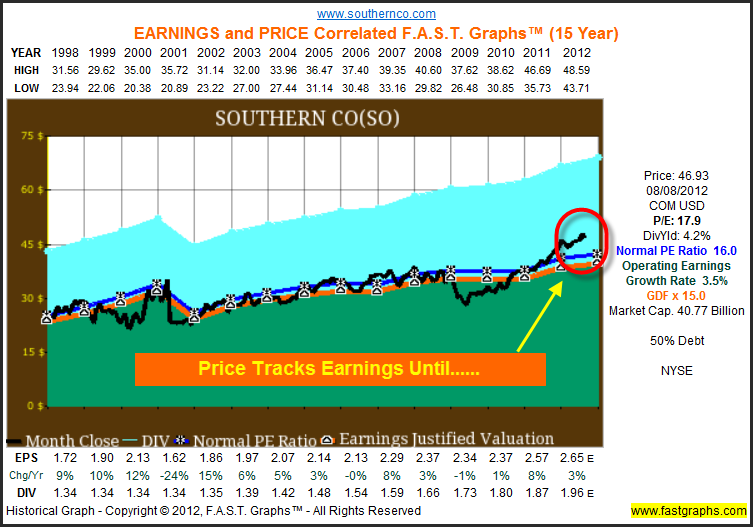
UIL Holdings Corp (UIL) – Directly from their website
“Headquartered in New Haven, Connecticut, UIL Holdings Corporation (NYSE:UIL) is a diversified energy delivery company serving a total of 699,000 electric and natural gas utility customers in 66 communities across two states, with combined total assets of over $4 billion.”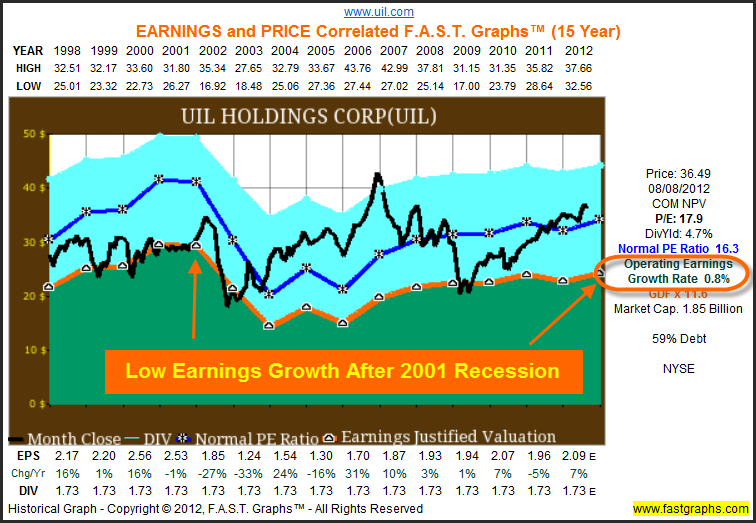
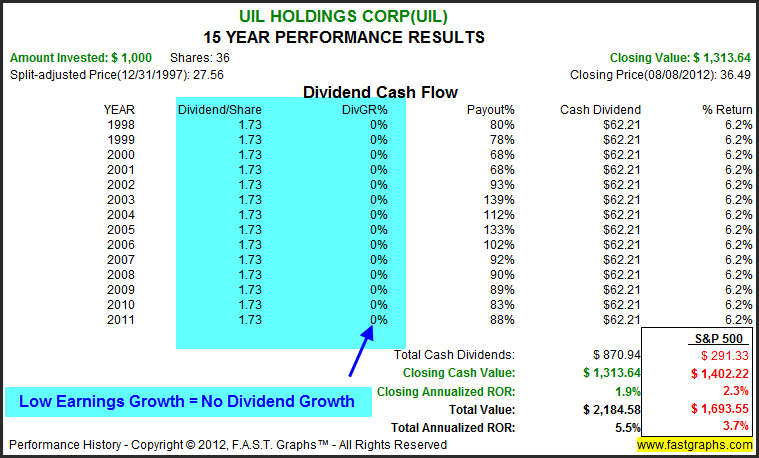
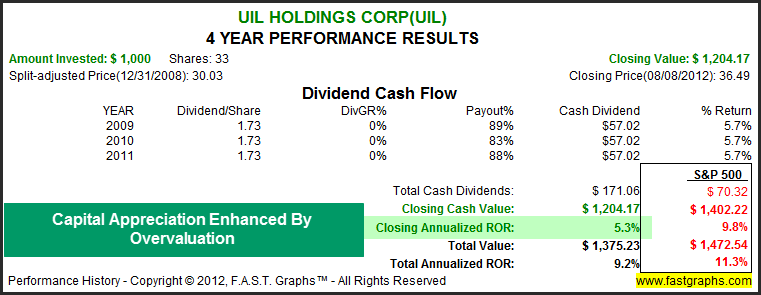
Because earnings fell so precipitously in 2001, the earnings and price correlation on the long-term graph above appears to be uncorrelated. Therefore, in order to expose the earnings and price relationship, a shorter time frame needs to be graphed. Furthermore, I chose a time frame where the company was fairly valued in the beginning and modestly overvalued at the end. Consequently, when you review the performance table, you will see that the capital appreciation of 5.3% (Closing Annualized ROR) is enhanced above the earnings growth rate of 2% due to current overvaluation.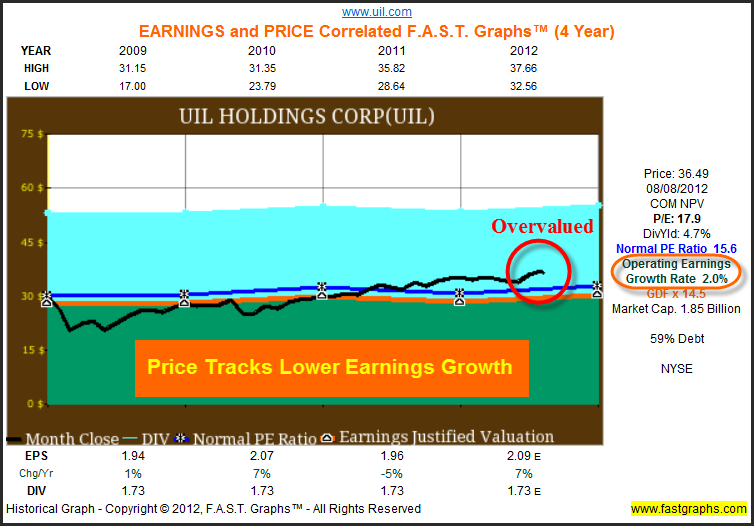
Summary and Conclusions
This series of articles was inspired by anecdotal evidence indicating that after a strong run-up in 2011, utility stocks had become overvalued. In general, after conducting research on utilities across the United States with this four-part series of articles, we have concluded that utilities are, in fact, overvalued. However, this conclusion was drawn after examining each respective utility stock one company at a time through the lens of the earnings and price correlated research tool F.A.S.T. Graphs™.
To clarify and elaborate on our view of the current valuation of utility stocks, the following qualifiers are necessary. First of all, throughout this series we did show a few utility stocks that appear to be reasonably priced. Furthermore, we found very few utilities that we would classify as highly or even dangerously overvalued. To put this in perspective, if we saw the same valuations on consumer staples that we see on utilities, we would consider them fully valued and not consider them excessively overvalued. But for the most part, our research has determined that utilities are fully valued with many moderately overvalued today.
On the other hand, we consistently pointed out that valuation regarding low growth entities, like utility stocks, is more critical. Therefore, when utility stocks are fully valued, as we find many to be today, prospective investors need to understand that the capital appreciation component might be minimal, and dividends will most likely represent the majority of potential returns. Additionally, when any actual overvaluation is present, capital appreciation could easily become negative if and when valuations revert to the mean.
Finally, utility stocks have historically attracted investors with their dividends. Although utility stock dividends do not have a history of fast growth, they do offer a legacy of above-average yield. Furthermore, the safety associated with the necessary nature of their businesses and their often monopoly status, is a plus for conservative, safety conscious investors desirous of yield. However, the price for safety has been regulated growth. Therefore, given the low yield investment environment we are currently in, utility stocks may still offer viable alternatives to low rate fixed income. However, we believe that caution and due diligence on a company-by-company basis is in order.
Disclosure: Long NEE, SCG at the time of writing.
Disclaimer: The opinions in this document are for informational and educational purposes only and should not be construed as a recommendation to buy or sell the stocks mentioned or to solicit transactions or clients. Past performance of the companies discussed may not continue and the companies may not achieve the earnings growth as predicted. The information in this document is believed to be accurate, but under no circumstances should a person act upon the information contained within. We do not recommend that anyone act upon any investment information without first consulting an investment advisor as to the suitability of such investments for his specific situation.
- English (UK)
- English (India)
- English (Canada)
- English (Australia)
- English (South Africa)
- English (Philippines)
- English (Nigeria)
- Deutsch
- Español (España)
- Español (México)
- Français
- Italiano
- Nederlands
- Português (Portugal)
- Polski
- Português (Brasil)
- Русский
- Türkçe
- العربية
- Ελληνικά
- Svenska
- Suomi
- עברית
- 日本語
- 한국어
- 简体中文
- 繁體中文
- Bahasa Indonesia
- Bahasa Melayu
- ไทย
- Tiếng Việt
- हिंदी
Most Eastern Utility Stocks Are Overvalued, Part 4
Published 06/02/2013, 07:42 AM
Updated 07/09/2023, 06:31 AM
Most Eastern Utility Stocks Are Overvalued, Part 4
Latest comments
Loading next article…
Install Our App
Risk Disclosure: Trading in financial instruments and/or cryptocurrencies involves high risks including the risk of losing some, or all, of your investment amount, and may not be suitable for all investors. Prices of cryptocurrencies are extremely volatile and may be affected by external factors such as financial, regulatory or political events. Trading on margin increases the financial risks.
Before deciding to trade in financial instrument or cryptocurrencies you should be fully informed of the risks and costs associated with trading the financial markets, carefully consider your investment objectives, level of experience, and risk appetite, and seek professional advice where needed.
Fusion Media would like to remind you that the data contained in this website is not necessarily real-time nor accurate. The data and prices on the website are not necessarily provided by any market or exchange, but may be provided by market makers, and so prices may not be accurate and may differ from the actual price at any given market, meaning prices are indicative and not appropriate for trading purposes. Fusion Media and any provider of the data contained in this website will not accept liability for any loss or damage as a result of your trading, or your reliance on the information contained within this website.
It is prohibited to use, store, reproduce, display, modify, transmit or distribute the data contained in this website without the explicit prior written permission of Fusion Media and/or the data provider. All intellectual property rights are reserved by the providers and/or the exchange providing the data contained in this website.
Fusion Media may be compensated by the advertisers that appear on the website, based on your interaction with the advertisements or advertisers.
© 2007-2025 - Fusion Media Limited. All Rights Reserved.
