Global markets recovered lost ground last week, although a measure of broadly defined commodities continued to fall, based on a set of exchange traded funds through Oct. 2.
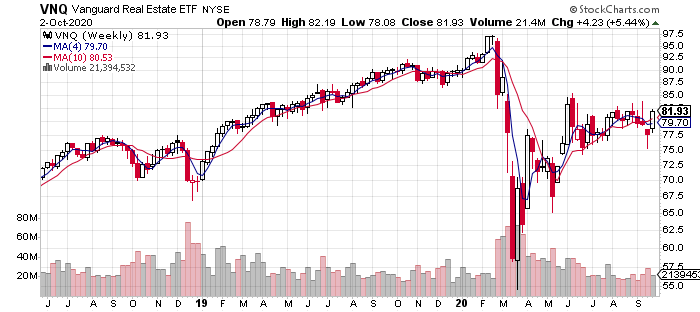
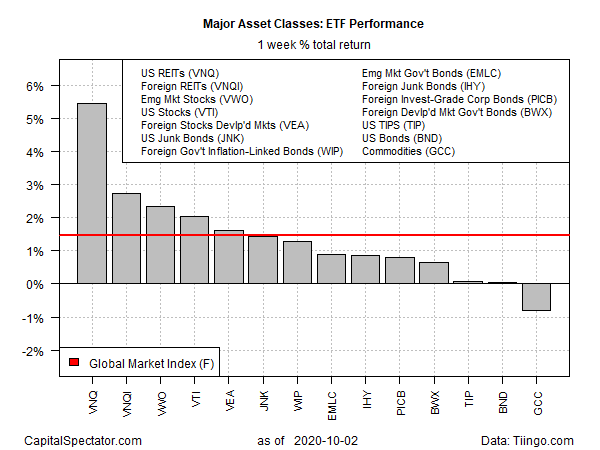
The strongest gainer for the major asset classes last week: US real estate investment trusts (REITs). After four straight weekly losses, Vanguard Real Estate (NYSE:VNQ) surged 5.4%. Despite the bounce, the fund remains in a trading range that has prevailed over the last two months.

Foreign property shares were the second-best performer last week, albeit well behind VNQ’s rally. Vanguard Global ex-U.S. Real Estate (NASDAQ:VNQI) rose 2.7%, recovering all of the previous week’s loss, and then some.
US stocks also participated in the last week’s bounce. Vanguard Total Stock Market (NYSE:VTI) rose 2.1%—the fund’s first weekly gain in five weeks.
US investment-grade bonds managed to eke out a fractional gain, just barely. Vanguard Total Bond Market (NASDAQ:BND) ticked up three basis points, although the ETF continues to trade in a tight band.
Commodities posted the only loss last week for the major asset classes. WisdomTree Continuous Commodity (NYSE:GCC), which equal weights a broad set of commodities, fell for a second straight week with an 0.8% decline.
The Global Markets Index (GMI.F) rebounded. This unmanaged benchmark, which holds all the major asset classes (except cash) in market-value weights via ETFs, rose 1.4%—recovering the previous week’s loss.

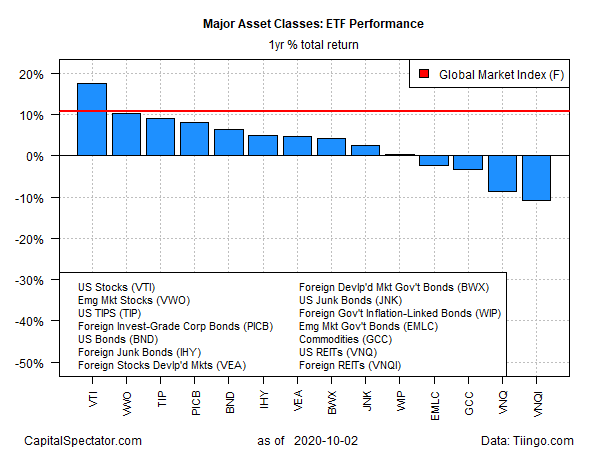
US equities continue to lead the major asset classes for the one-year return window—by a wide margin. VTI closed last week with an 18.4% total return.
VTI’s increase is well ahead of the second-best one-year performance via Vanguard FTSE Emerging Markets (NYSE:VWO), which is up 11.6% from its year-earlier close after factoring in distributions.
The worst performer for the one-year window: foreign property shares. VNQI is down 10.2% for the past 12 months.
GMI.F’s one-year performance: 10.7%.

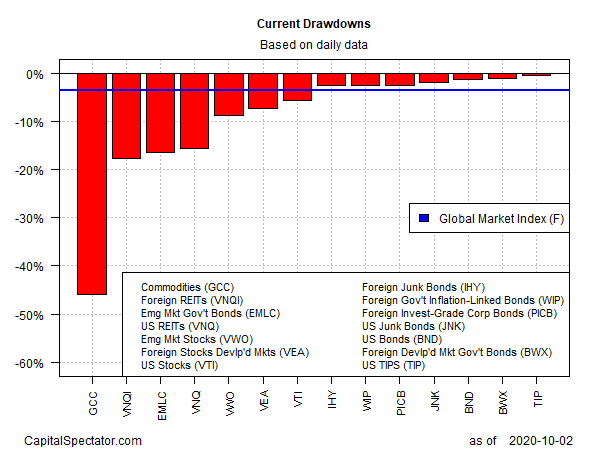
Current drawdowns for the ETF proxies tracking the major asset classes range from a slight 0.5% peak-to-trough decline for inflation-indexed Treasuries (TIPS) to a hefty 46% crash for broadly defined commodities (GCC).
GMI.F’s current drawdown is a 3.6% decline from its previous high.

