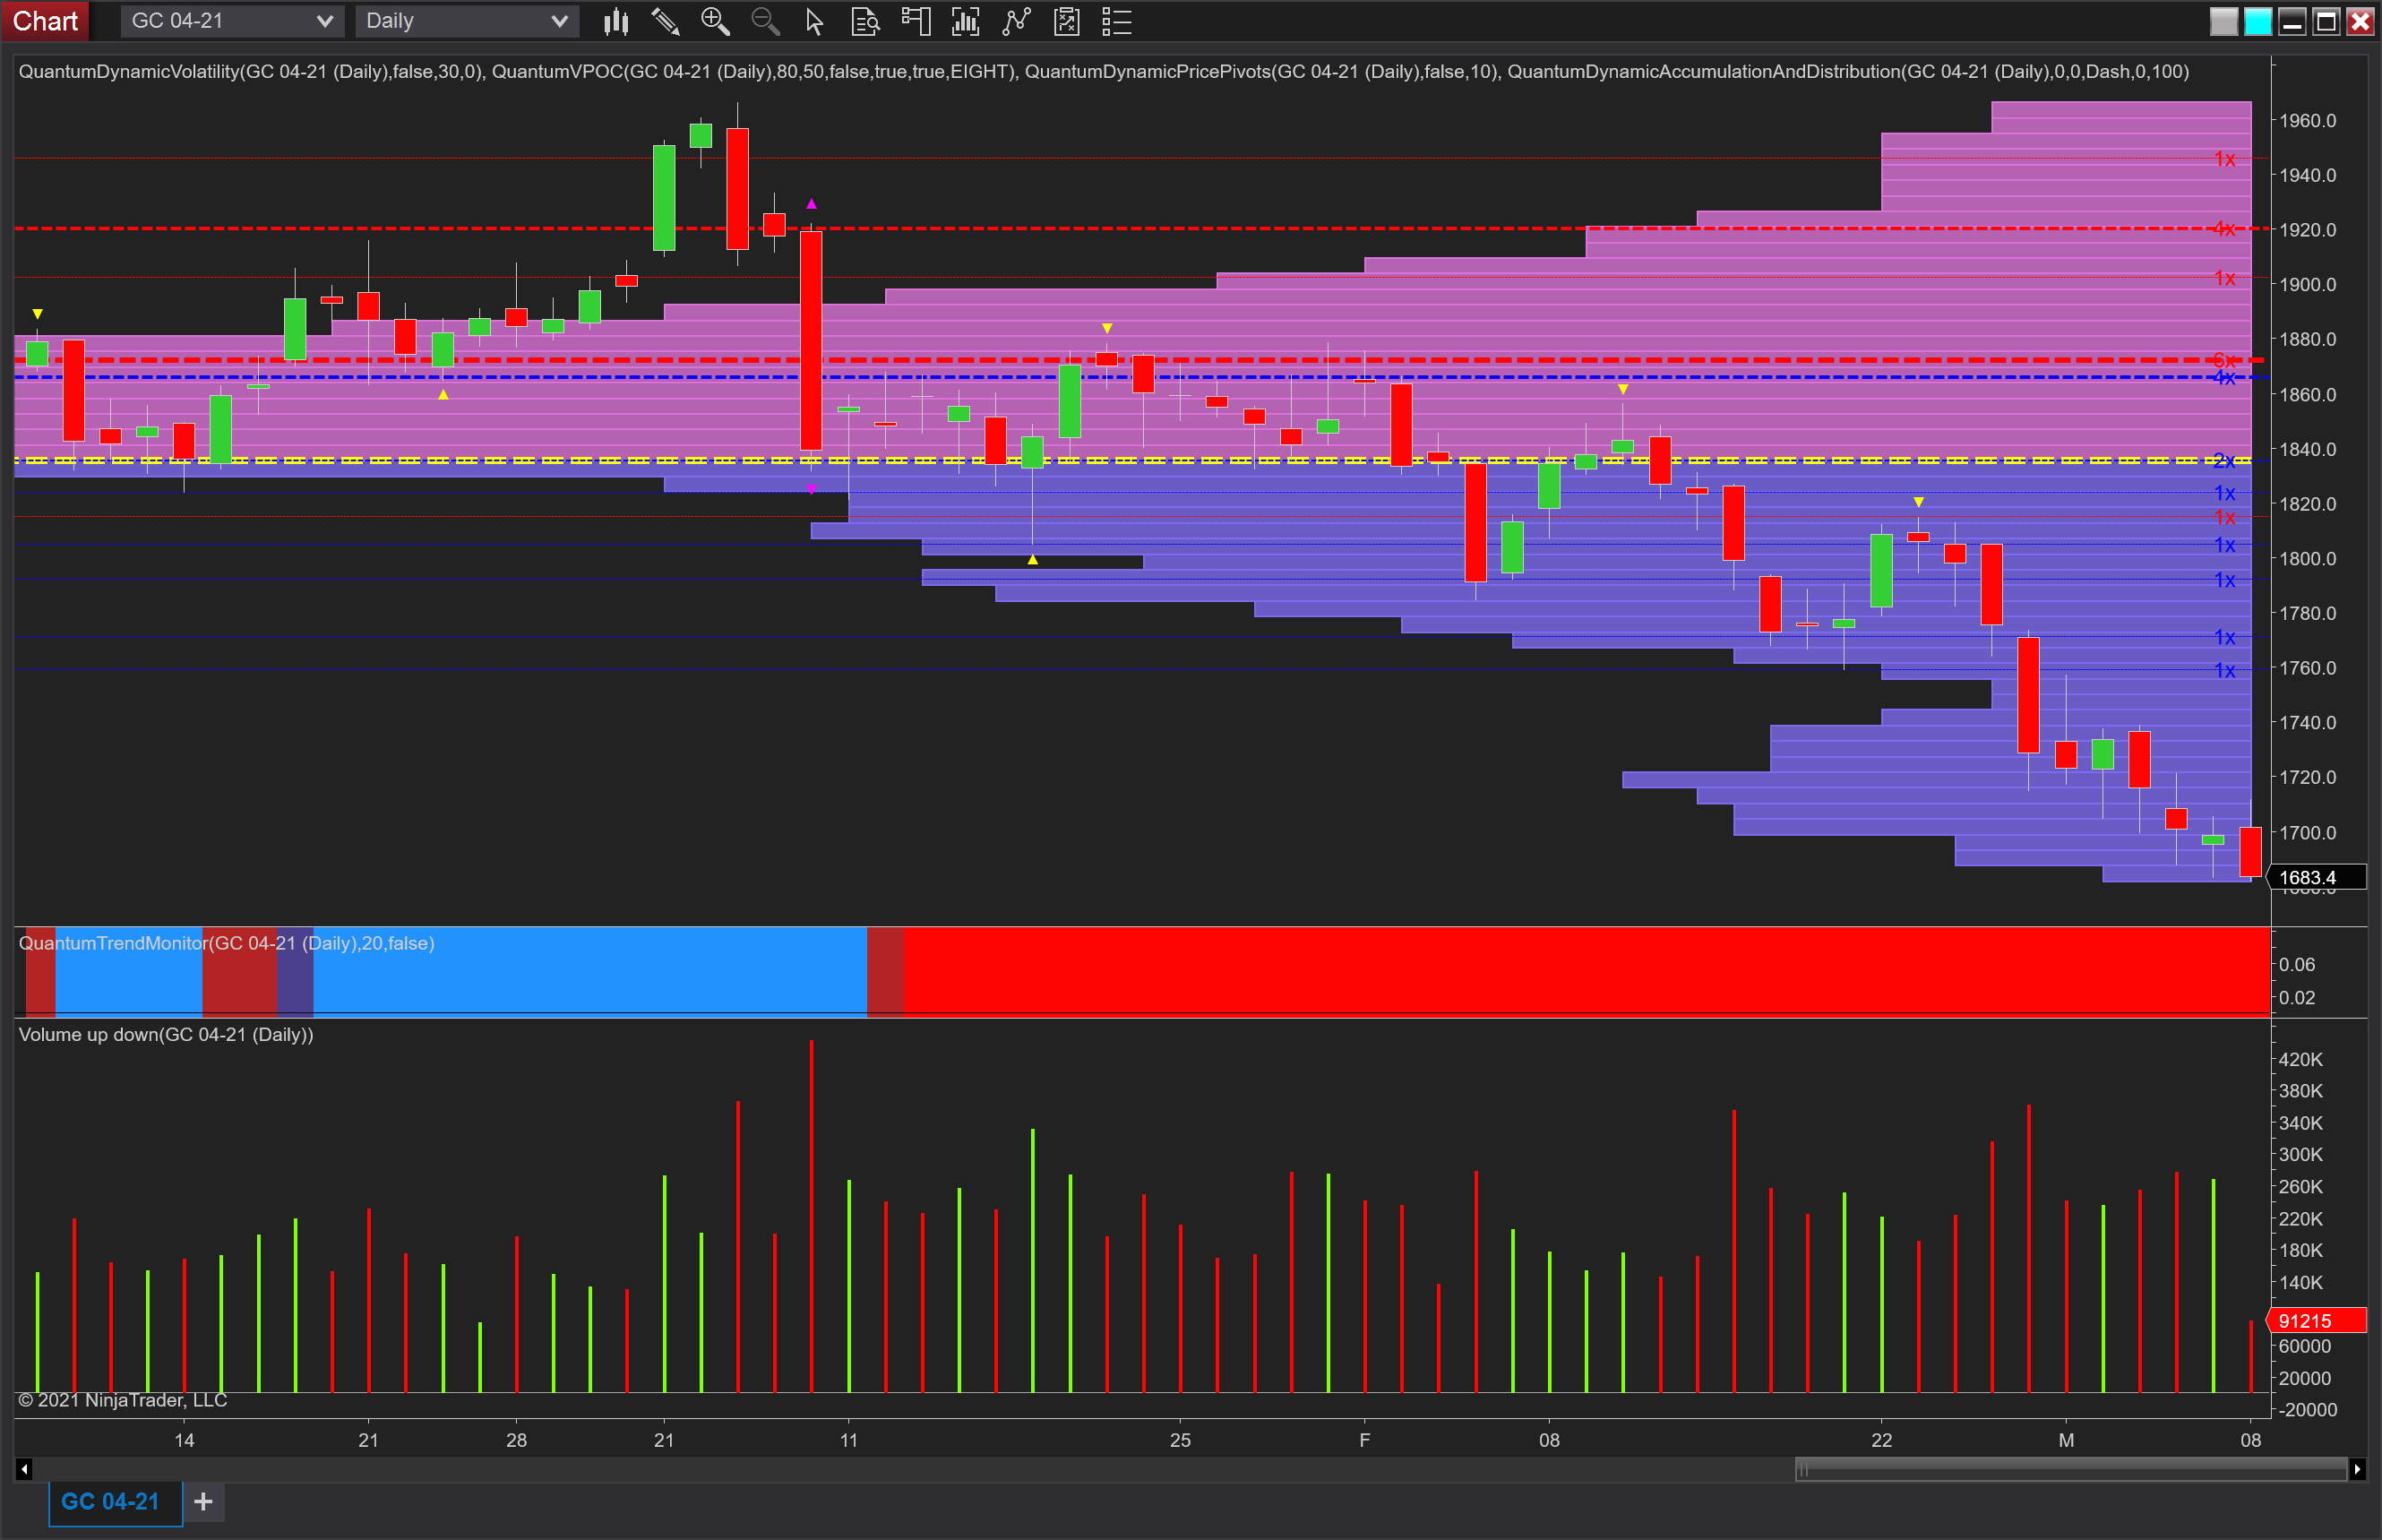
Like many, I am probably a closet gold bug as my heart would suggest that gold, when viewed from any perspective should rise. However, from a trading perspective, my head rules my heart and the bearish and negative outlook I have been writing about over the last few weeks for the precious metal has continued to drive the metal lower with relentless pressure as it moves ever further away from the VPOC which adds its own bearish weight.

Last week’s price action on the daily chart showed little to no evidence of any serious buying, with only Tuesday and Friday suggesting minor interest. Unlike February and March where gold made some feeble attempts to rally, we have yet to witness this in March and indeed earlier the price of gold moved below the $1700 per ounce level. The area being tested is important as it is at the extreme of the volume point of control histogram where volume falls away dramatically, and as a result, we can expect the price to move through here rapidly as there is nothing to provide any technical support, whether price-based or volume-based. The slide lower has also been given additional momentum with the recent recovery in the US dollar.

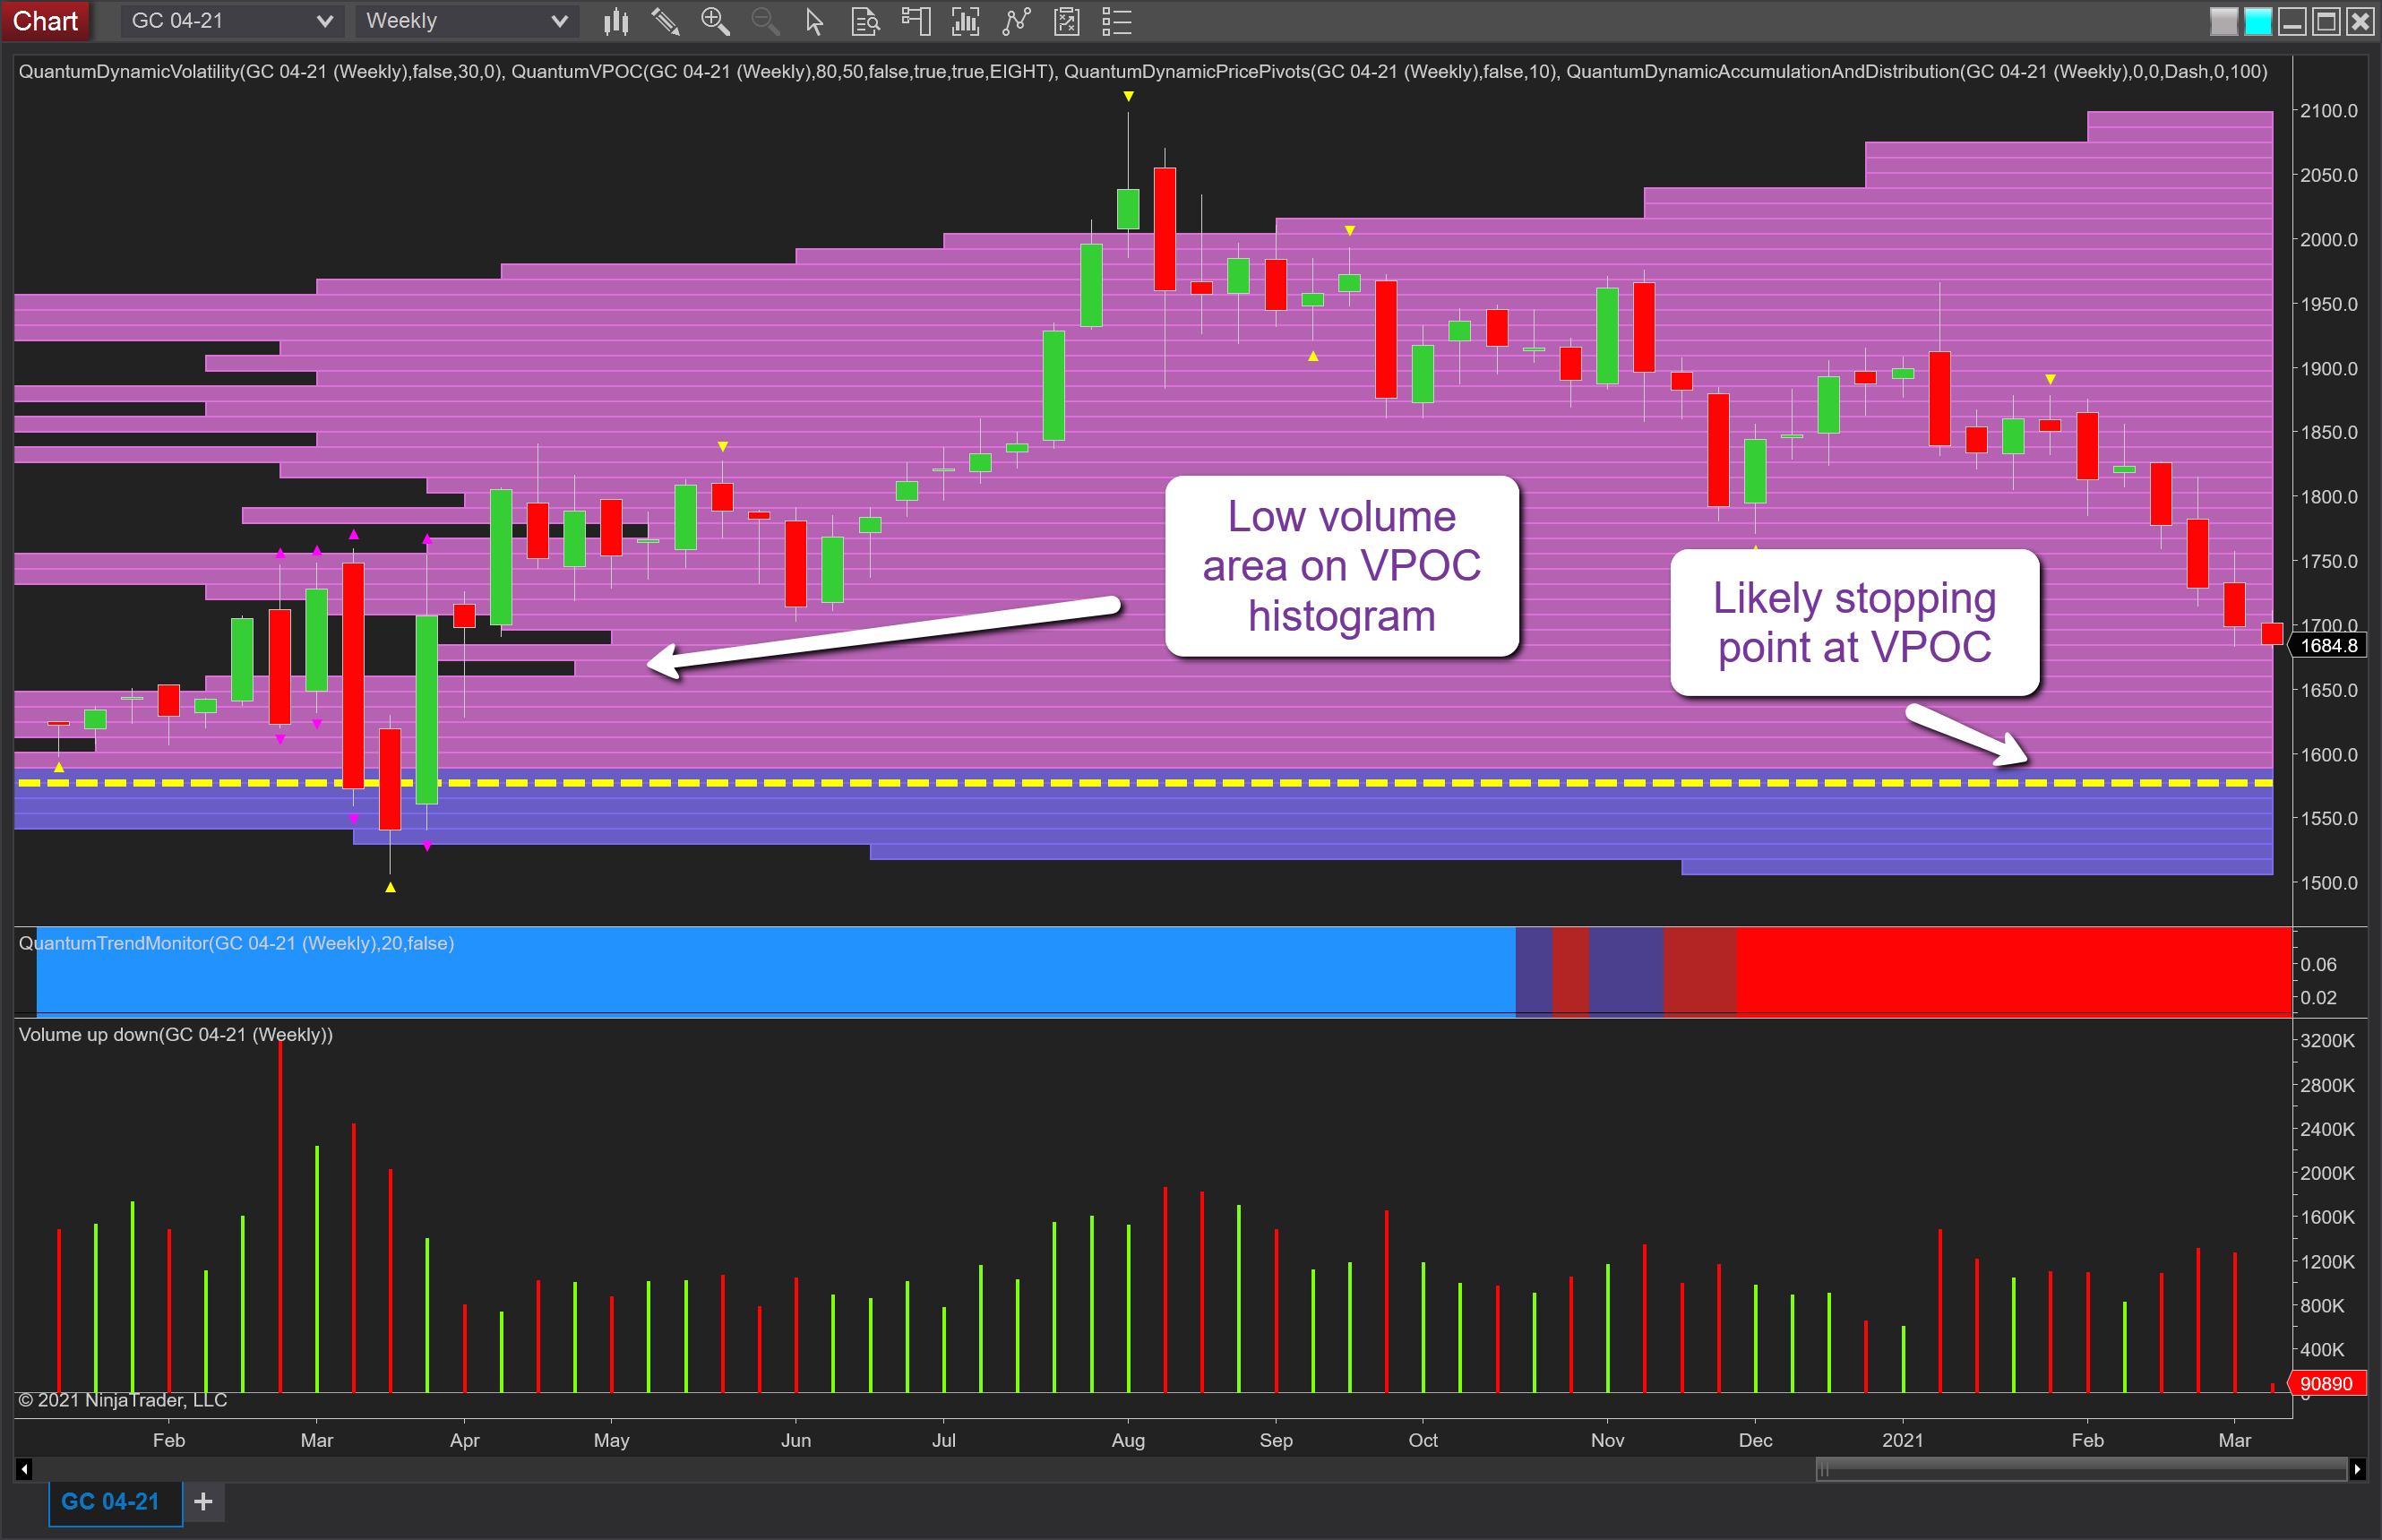
If we move to the weekly chart this gives us a broader horizon on which to judge any pause points or the next major downside destination for gold. And depressing as it may seem for gold bugs, the most likely and strongest level at which it may find good support is at the VPOC on this timeframe which resides at $1560 per ounce, so perhaps a further $100 per ounce to shed before help arrives. On its way there and extending to $1640 per ounce volume falls away on the VPOC histogram so a further another reason to expect a continuation and on both charts, the trend monitor indicator also remains bright red confirming the current picture.
