Gold traders have been on a wild ride lately and it looks like it could continue with plenty of events on the economic calendar this week.
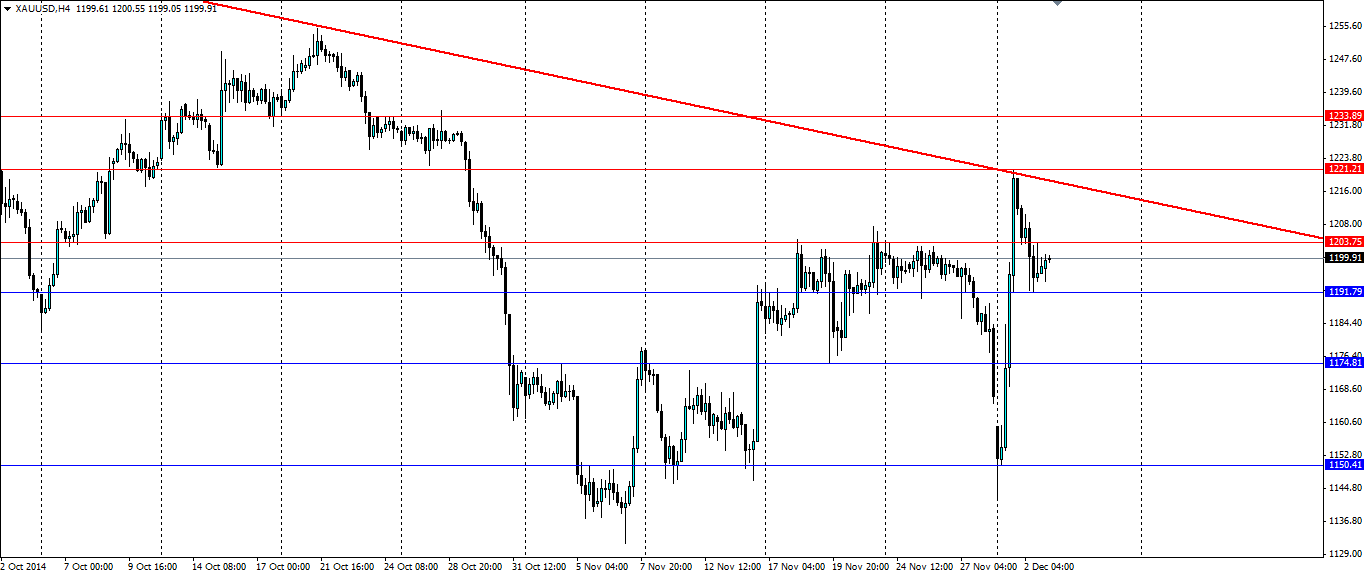
The Rollercoaster has seen gold prices swing between $1140 and $1220 an ounce over the last week. The Swiss referendum on whether the SNB should hold 20% of its reserves as gold failed, causing support to give way. Shortly after a large price rise in Oil saw gold follow suit as traders speculated that a higher gold price would act as a drag on consumption and therefore growth.
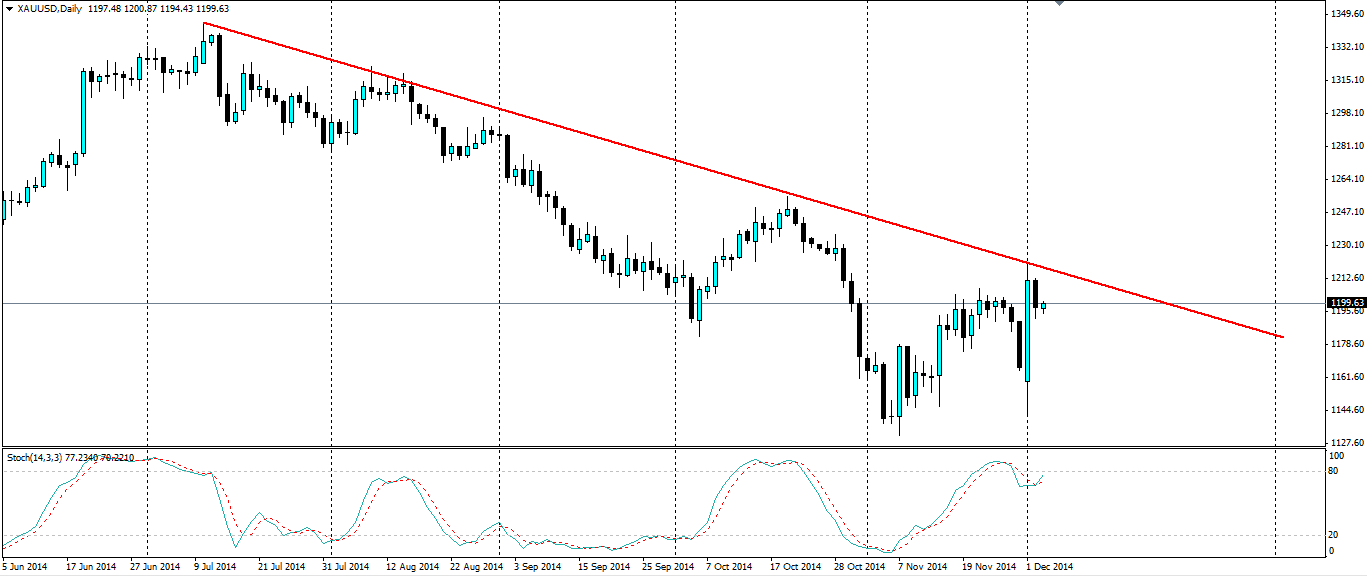
Gold seems to have overextended itself as the buying pressure pushed the price up for a perfect touch of the trend line. This was the cue the bears were waiting for and they swiped the price back down to the $1200 mark as the bulls took profit. The Stochastic Oscillator shows the price moving into oversold territory are retracing with the rejection off the trend line. It looks solid and another touch would be a good trigger for a short position.

The week ahead should see the volatility remain with no less than three central banks meeting to set interest rates and share their thoughts on the state of their respective economies. The Bank of Canada meets today and is expected to hold the rate at 1.0%. We may see a move from “ultra-neutral” to a slightly more hawkish stance as Canada has been performing relatively well recently, however, Governor Poloz may sight falling oil prices as a problem.
Tomorrow sees the Bank of England set their interest rate, which is expected to remain at 0.5%, however, this will be overshadowed by the ECB meeting. Many are expecting another round of stimulus from Draghi and tomorrow could be the day we see QE.
Events in the US today are the ADP non-farm payroll figures and the ISM Manufacturing PMI, while tomorrow the Unemployment Claims figures are released. Friday is the day when we can expect the most volatility in Gold as the Non-Farm Payroll data is released. This is the biggest event of the month across most markets and gold is no different. The market expects a rise from 214k to 228k which would be a good result and is entirely attainable given the strength in the US at the moment. I would not be surprised if we see a result to the upside of this estimate.
If the overall sentiment in the US is strong, especially from the Nonfarm result, look for gold to head back towards the lower end of the current range. Support for a movement lower can be found at 1191.79, 1174.81 and 1150.41. If we see a movement higher, the price will look to find resistance at 1203.75, 1221.21 and 1233.89, of course with the bearish trend acting as dynamic resistance.

The volatility in the gold markets looks set to continue with a few days of big data. Plenty of US data and three central banks setting interest rates will keep gold traders busy.
