Another choppy, tough weak with stock wanting higher, then wanting lower but in the end, trying to breakout higher, for now.
It’s a tough time to try to trade for sure and I’m in an all cash position, but getting tempted.
We did see some nice strength Friday but it’s month end rebalancing so I decided to not hold positions over the weekend when anything can happen, and to wait and see if this strength can be carried over into the new month.
In these types of markets, capital preservation is more important than trying to be cute and trade.
I like to call it a coin flip type of market since anything can happen.
As for the metals, they tried to go higher but are now stalling, so as with markets and stocks, they just aren’t acting great or with any predictability.

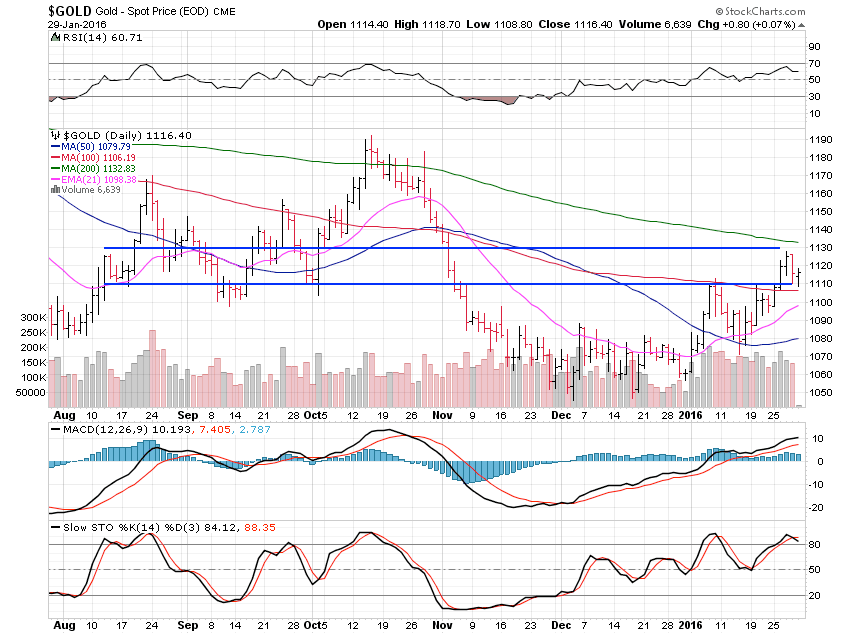
Gold gained 1.66% this past week but backed off the $1,130 area where the 200 day average is near.
So, for now we chop between $1,130 and $1,110 with a break of this range a buy, or short level.
Gold looks like it wants to continue higher up to the $1,150 or $1,160 areas but silver is still having trouble getting going and in order for gold to move, silver also has to be on the move.

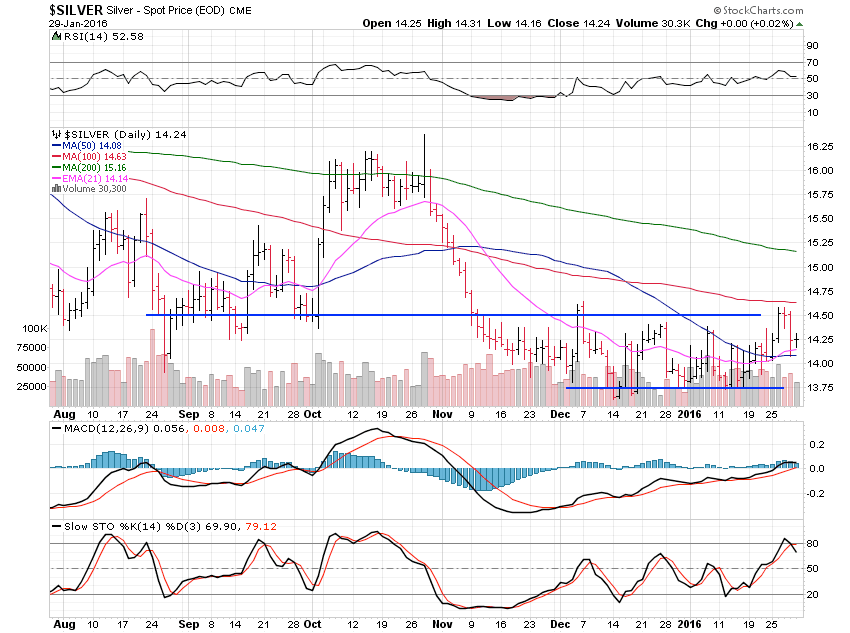
Silver gained 1.59% this past week and did try to breakout, but is failing.
So, with silver back in the range between $13.75 and $14.50, gold will have a hard time moving higher.
As with markets and stocks, the metals are showing me mixed messages so it’s hard to have confidence to take many positions, or hold them overnight and doubly so, over a weekend.
There is nothing wrong with doing nothing.
Doing nothing keeps your real and mental capital fully intact and ready to hit it hard once the next round of great setups come.
We only get 2 or 3 really great times to be heavy into markets a year and usually the rest of the time is watching the charts build for those setups to form.

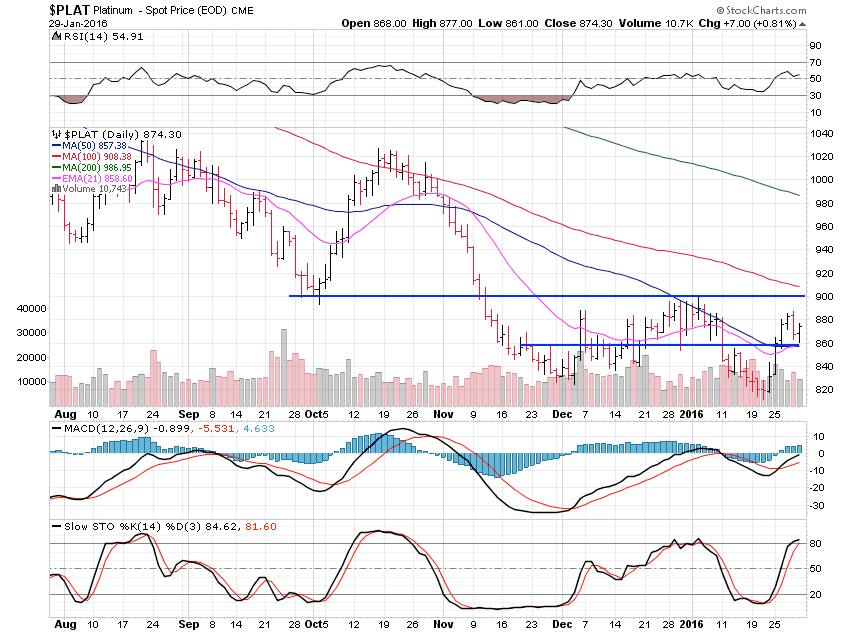
Platinum gained a solid 5.10% this past week but really isn’t going anywhere quite yet.
We need to see a break above $900 to really get going and target the $980 and $1,020 areas.
This is positive action though, chopping between $860 and $900, but as always gold and silver also need to be moving higher for platinum to really have much of a chance.

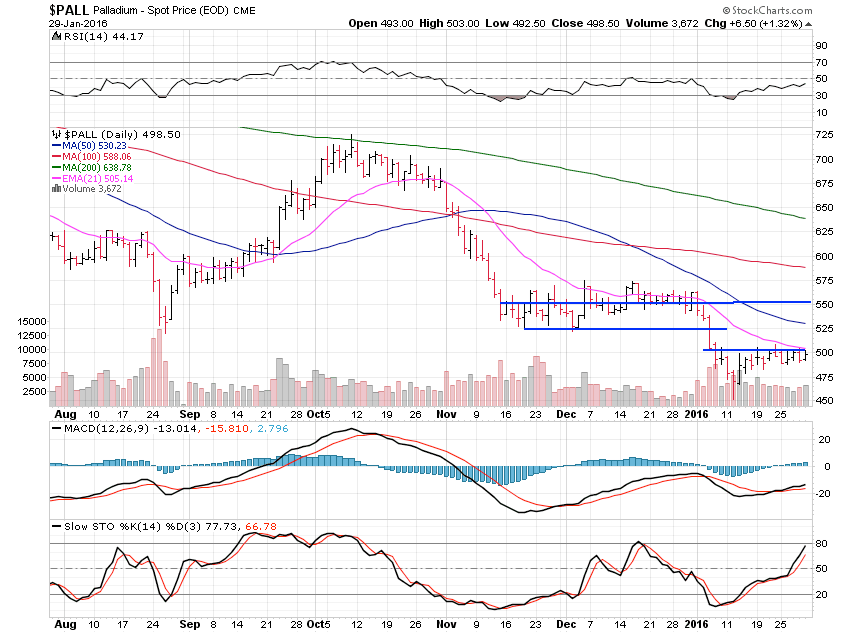
Palladium gained only 0.34% as it consolidates before it looks set to attempt a break higher.
A break above $500 and the 21 day moving average should see palladium move to $550 but there is some resistance to watch the action at $525.
As always the caveat of gold and silver also moving higher applies.
To sum up, we’ve got lots of mixed signals in the metals, markets and stocks which makes it tricky.
Things can change quickly and may next week but for now I’m all back to cash and in wait and see mode.
It is nice to have no positions sometimes but it does get frustrating as well, but it’s far worse to try to trade and get chopped up.