Key Points:
- Highly bearish trend line.
- EMA activity remains bearish.
- Dynamic support could be broken.
Oil prices are continuing to plunge, despite consistent draws being reported in the US Crude Oil Inventories results. What’s more, the commodity’s technicals are indicating that it may have some further downside potential in store for the coming weeks. Notably, the development of the highly bearish trend line and the imminent change of direction in the 100 day EMA could spell protracted losses for the commodity.
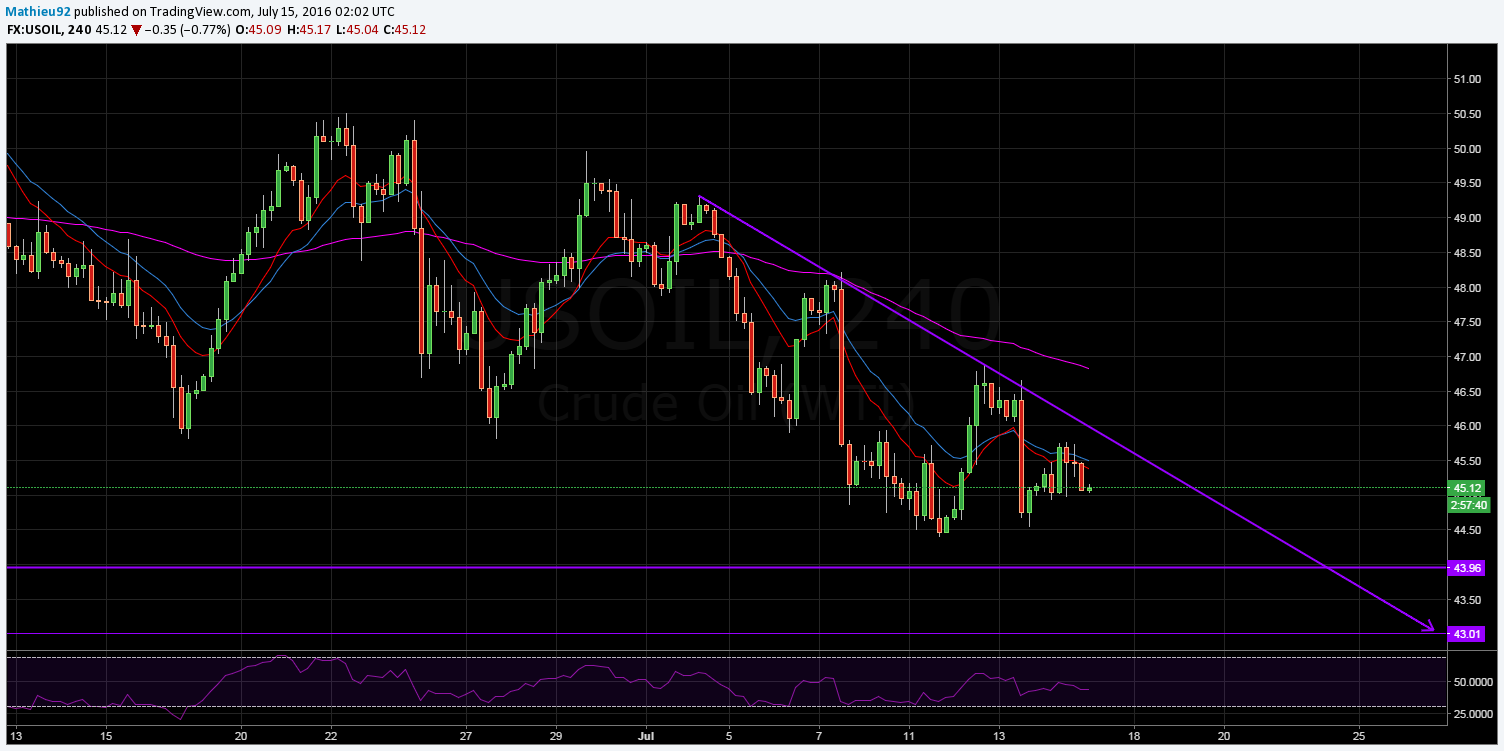
First and foremost, as is made clear on the H4 chart, oil is developing an increasingly robust bearish trend line. This trend has held firm ever since the commodity initially began to decline and has weathered multiple attempts at an upside breakout. As a result, even if oil should decide to rally as the week comes to a close, it would be highly irregular if it managed to break out.
The descent of oil has been exacerbated by the increasingly bearish nature of its EMA activity over the past number of weeks. On the H4 chart for instance, the 12, 20, and 100 period EMA’s have been relentlessly bearish ever since the plunge which occurred in the wake of the double top which formed early July. What’s more, whilst the 12 and 20 day EMA’s have been bearish for some time, the 100 day is now beginning to take a turn to the downside.

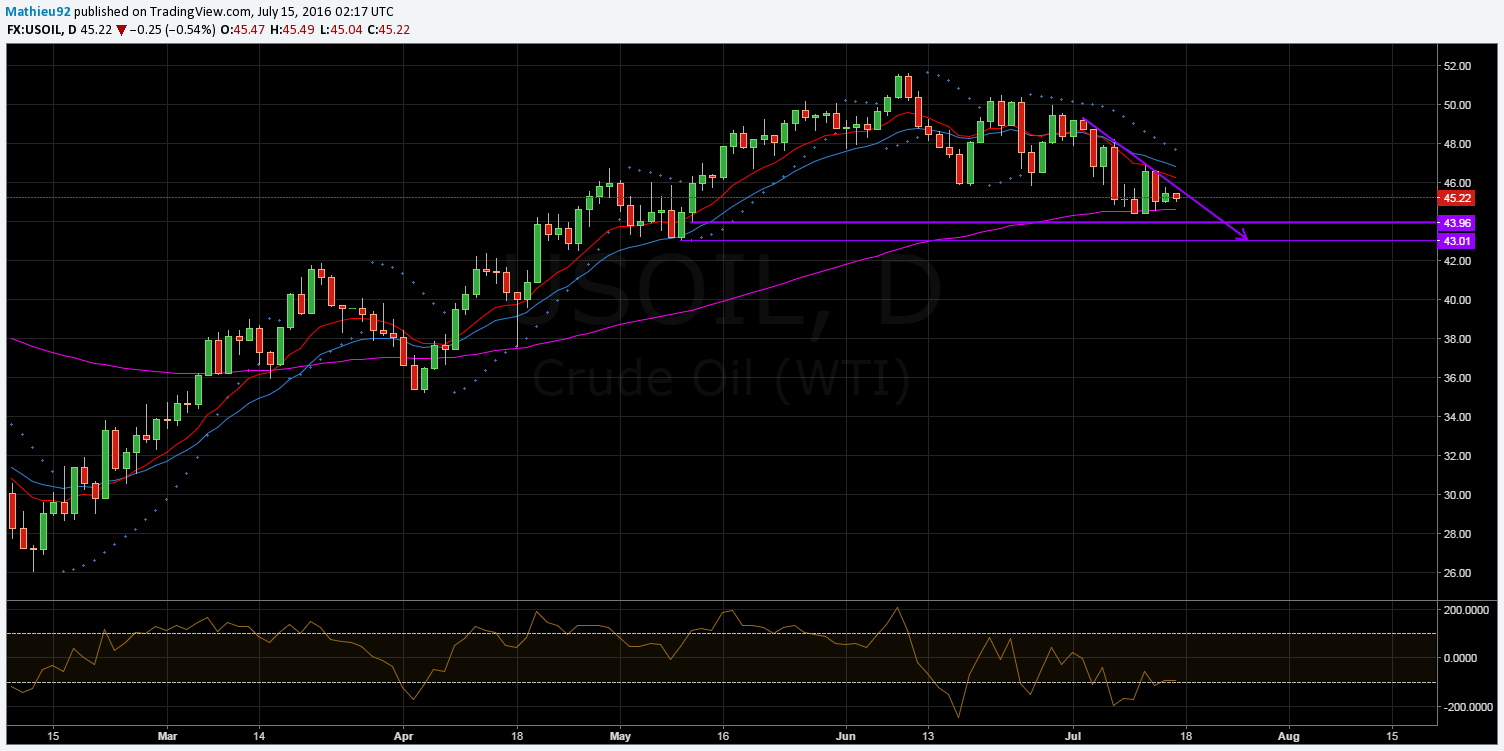
Importantly, the 100 day EMA has actually been a source of dynamic support for oil and if the commodity breaks this support, it could tumble significantly. As is shown on the daily chart, oil is coming perilously close to breaking the support supplied by the 100 day EMA. Moreover, now that the CCI oscillator has moved out of oversold territory, support around the 44.40 level will be drastically weakened.

In addition to the EMA activity and CCI, the Parabolic SAR readings are still signalling that the commodity is amid a full blown downtrend. As a result of this, it now looks highly likely that the 43.96 and 43.01 zones of support could be the next levels to be challenged seriously. These zones are both looking relatively firm, however, if a crossover of the 100 day EMA occurs they could yet be broken.
Ultimately, the embattled commodity is having some difficulty gaining much traction and most of its surges in price are being erased in subsequent sessions. At its current trajectory, oil could be as low as $43 by the month’s end and could go lower still. However, keep an eye on the US inventories results as they are likely to give some temporary price boosts to the commodity as it descends.
