Moody’s downgrades Brazil to Baa3
After having changed Brazil’s rating outlook from stable to negative last September, Moody’s finally downgraded Brazil’s government bond rating to Baa3 from Baa2 and changed the outlook to stable. The decision was broadly expected and came on the back of disappointing economic performances, missed primary surplus targets and political jitters that leave investors facing a foggy outlook.
According to the latest weekly economic survey released by the Central Bank of Brazil (BCB) on Monday, market consensus growth estimate declined from -1.80% to -1.97% for 2015 and from 0.20% to 0.0% for 2016 as bad news keep piling up. More worryingly, inflation expectations for 2016, which had seemed to have finally anchored throughout July, are on the rise again as economists expect IPCA inflation to reach 5.44% in 2016 versus 5.40% a week ago. Given the political instability, which will likely result in an increase in government’s spending, together with rising inflation expectations, we think that the BCB will have no choice but to increase interest again. USD/BRL closed at 3.4743 in the previous session and is expected to open higher given latest developments.
Japan’s PPI change at its lowest since 2009
Last night, the Japan’s Producer Price Index fell to 3% year-on-year from -2.4% y/y in June, its lowest change since 2009. It also decreases more than the estimates at around -2.9% y/y. Japan’s Abenomics is currently failing to stimulate consumer spending in order to enter into the virtuous circle of growth and inflation. Besides, PPI and CPI usually move together and follow the same trend which shows that Japan’s monetary policy is still not efficient. In addition, the fiscal arrow of the Abenomics had a single effect: reducing consumer spending. Increasing VAT from 5% to 8% - from an original idea of the IMF - had a spectacular impact. The other VAT increase which was initially set to be in 2016 has been postponed in 2017. Therefore, as time goes by, it becomes more and more difficult to see any success in the Abenomics. In particular the country is largely hit the collapse of commodity price. Last Friday, the Bank of Japan governor’s Haruhiko Kuroda stated that he would trigger more stimulus if the weak oil prices persist to hold inflation at a very low level. The yen monetary base will increase again. It currently increases at a pace of yen 80 trillion a year. We remain bullish on the USD/JPY which is still trading at its highest level since 2007. We expect the pair to increase again above 125.
CNY devaluation increases pressure on USD
Yesterday’s surprise CNY “one-time devaluation” and todays further CNY revaluation has put the Fed September rate hike in doubt. US yields curve shifted lower with the 10-Year yields falling to 2.057% from 2.15%. With pressure mounting on the USD, US corporations are further losing competitive positioning and negative spillover effect into inflation should be concerning to the FOMC members. Yet we still see a high probability of a rate hike in Septembers after last week’s decent NFP read and recent FOMC statements. Traders need to refocus on US fundamentals. Today’s JOLTS job openings are anticipated to remain solid with consensus at 5350k against prior read of 5363. EUR/USD has traded higher to 1.1154 as USD long positioning remains extended and yields have lost ground. Despite the setback we remain bearish on the EUR/USD.
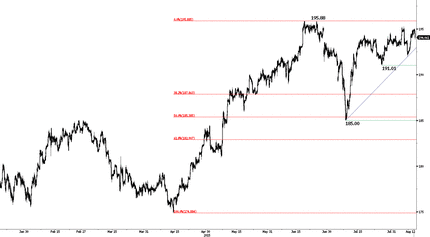
GBP/JPY - Approaching Resistance at 195.88

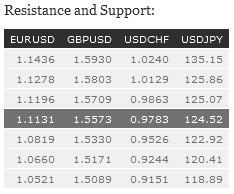
EUR/USD has broken resistance at 1.1045 (declining channel). Over the last month, the pair is still setting lower highs therefore we remain bearish over the medium-term. Hourly resistance lies at 1.1278 (29/06/2015 high). Stronger resistance lies at 1.1436 (18/06/2015 high). Support can be found at 1.0660 (21/04/2015 low). In the longer term, the symmetrical triangle from 2010-2014 favors further weakness towards parity. As a result, we view the recent sideways moves as a pause in an underlying declining trend. Key supports can be found at 1.0504 (21/03/2003 low) and 1.0000 (psychological support). Break to the upside would suggest a test of resistance at 1.1534 (03/02/2015 reaction high).
GBP/USD has shifted into a consolidation pattern after slight bullish recovery. However, drift lower indicates persistent selling pressure. Stronger support is given at the 38.2% Fibonacci retracement at 1.5409. Hourly resistance is given at 1.5733 (01/07/2015 high). We remain bearish on the pair. In the longer term, the technical structure looks like a recovery bottom whose maximum upside potential is given by the strong resistance at 1.6189 (Fibo 61% entrancement).
USD/JPY continues to recover after its recent sell-off. However, the pair is now challenging the upside trend-line at around 124.50. In addition, the road is still wide open towards the stronger resistance at 125.86 (05/06/2015 high). Hourly support is given by the 38.2% Fibonacci retracement at 122.04. A long-term bullish bias is favored as long as the strong support at 115.57 (16/12/2014 low) holds. A gradual rise towards the major resistance at 135.15 (01/02/2002 high) is favored. A key support can be found at 118.18 (16/02/2015 low).
USD/CHF has thus far failed to hold above 0.9900, suggesting persistent selling pressures. (13/04/2015 high). The pair still remains in a short-term upside momentum. Hourly support can be found at 0.9151 (18/06/2015 low). In the long-term, there is no sign to suggest the end of the current downtrend. After failure to break above 0.9448 and reinstate bullish trend. As a result, the current weakness is seen as a counter-trend move. Key support can be found 0.8986 (30/01/2015 low).

